Use the Sodium Intake Calculator
Free sodium intake calculator that totals a full day in mg, converts salt to sodium, and shows how much sodium per day fits your 1,500 or 2,300 mg limit.
1. Which daily sodium limit applies to you?
Three official numbers exist and they disagree. Your blood pressure decides which one to aim at.
Daily limit to measure against2. Add everything you ate today
106 foods with sodium and potassium per serving. Tap to add; tap again to add another serving.
106 matches, sorted as listed. Sodium first, potassium in grey.
Your day
11 items logged.
Instant oatmeal, flavoured packet
1 x 1 packet (43 g)
Milk
1 x 1 cup (240 ml)
Banana
1 x 1 medium
White bread
2 x 1 slice (28 g)
Deli turkey breast
1 x 2 oz (56 g)
American processed cheese
1 x 1 slice (21 g)
Canned chicken noodle soup
1 x 1 cup prepared
Pasta, cooked unsalted
1 x 1 cup
Jarred pasta sauce
1 x 1/2 cup
Broccoli, cooked
1 x 1 cup
Table salt
1 x 1/4 tsp (1.5 g)
Your sodium for the day
3,488 mg
= 8.9 g of salt, about 1.5 teaspoons
152% of your limit — 1,188 mg over
Salt equivalent
8.9 g
1.5 tsp
vs US average
+88
mg vs 3,400 mg
Potassium
2,206
mg / 3,510 target
Na:K molar ratio
2.7
target 1.0 or below
Sodium-to-potassium ratio: About the US average. In the NHANES follow-up study this ratio predicted cardiovascular death more strongly than sodium counted on its own, which is why adding potassium-rich food changes your number as much as removing salt does.
Where your sodium is coming from
The salt shaker accounts for 31% of this day. Nationally it is about 5% — over 70% is already inside packaged and restaurant food before it reaches your kitchen.
- Condiments & salt1,070 mg (31%)
- Canned & frozen890 mg (26%)
- Meat & fish570 mg (16%)
- Bread & grains511 mg (15%)
- Cheese & dairy405 mg (12%)
- Fresh & whole42 mg (1%)
The items doing the damage
Ranked by milligrams, not by how salty they taste. Cured meat, bread and canned soup rarely taste of salt at all.
Same meal, 2,187 mg less sodium
These are like-for-like product substitutions, not diet changes — the same food in a lower-sodium version. Applying all of them takes this day to 1,301 mg (57% of your limit).
Canned chicken noodle soupCanned soup, low sodium
−750 mgDeli turkey breastRoast chicken breast, home-cooked
−527 mgJarred pasta saucePasta sauce, no salt added
−435 mgAmerican processed cheeseSwiss cheese
−260 mgInstant oatmeal, flavoured packetRolled oats, cooked plain
−215 mgWhat getting to your limit would be worth
Cutting 1,188 mg of sodium per day predicts a fall of about 1.2 mmHg in systolic blood pressure for someone with normal blood pressure. That comes from the 2013 meta-analysis of 34 sodium-reduction trials, where a 2,300 mg cut moved systolic pressure 5.8 mmHg in hypertensive adults and 2.4 mmHg in normotensive adults.
A population estimate, not a personal promise. Roughly a quarter of adults are salt-resistant and barely move; salt-sensitive people move considerably more.
Salt to sodium converter
Salt is only 39.34% sodium by weight. European labels print salt in grams, US labels print sodium in milligrams, and recipes speak in teaspoons — this converts between all three.
- Sodium: 2,360 mg
- Salt: 6 g
- Teaspoons of salt: 1
- Share of your daily limit: 103%
Daily sodium limits by authority
| Guideline | Sodium | Salt | Applies to |
|---|---|---|---|
| AHA ideal limit | 1,500 mg | 3.8 g | Most adults, especially with raised blood pressure |
| WHO recommendation | 2,000 mg | 5.1 g | All adults worldwide |
| US Dietary Guidelines | 2,300 mg | 5.8 g | Healthy adults and children aged 14+ |
| DGA, ages 9–13 | 1,800 mg | 4.6 g | Children 9 to 13 |
| DGA, ages 4–8 | 1,500 mg | 3.8 g | Children 4 to 8 |
| Actual US average intake | 3,400 mg | 8.6 g | What adults eat now |
Estimates, not a prescription. Values are typical figures from USDA FoodData Central and published brand data; identical products vary by manufacturer and recipe, so read the Nutrition Facts panel whenever one is in front of you. Anyone on a fluid-restricted, heart-failure, dialysis or lithium regimen should follow the number their clinician set rather than a general guideline, and potassium-based salt substitutes are unsafe in advanced kidney disease or on potassium-sparing diuretics.
Educational tool, not medical advice. Check this tool’s method and limitations before interpreting a result. Talk to a qualified healthcare professional before making decisions about medication, diet, exercise, or treatment. See our Terms of Use.
Your rating helps improve Sodium Intake Calculator. We store only an anonymized vote (no personal data).
How to Use Sodium Intake Calculator
Step 1: Pick the daily limit that applies to you
In step 1, choose Normal or Elevated blood pressure. The tool marks one of the 1,500 mg, 2,000 mg and 2,300 mg chips as suggested — 1,500 mg if your pressure is raised, 2,300 mg if it is not. Tap Custom to type a figure a clinician gave you.
Step 2: Add everything you ate today
Search the food box for a name such as soup, deli, pizza or soy sauce, or filter with the Bread, Meat, Cheese, Canned, Restaurant, Condiments, Snacks and Fresh pills. Tap a row to add one serving; tap it again to add a second.
Step 3: Correct the serving counts
In the Your day list, use the minus and plus buttons to match what you actually ate — two slices of bread, half a can of soup. Sodium scales linearly, so 0.5 servings is half the milligrams. The × button deletes a row entirely.
Step 4: Read the total, the salt equivalent and the bar
The headline is total sodium in milligrams, with grams and teaspoons of salt underneath. The bar fills toward your chosen limit and turns amber, orange then red as you pass 80%, 100% and 150% of it.
Step 5: Find out where the sodium is coming from
The stacked bar splits your day by food category, and the ranked list below names the six items contributing the most milligrams. Compare the salt-shaker share against the national figure of roughly 5%.
Step 6: Apply the like-for-like swaps
If your day contains products with a lower-sodium version — canned soup, deli meat, jarred pasta sauce, soy sauce, processed cheese — the swap panel lists each one with the milligrams it removes. Press Apply all swaps to rebuild the day with them.
Key Features
- Day builder totalling sodium across 110 named foods and brands
- Measures against 1,500, 2,000 or 2,300 mg, or a clinician-set limit
- Salt-to-sodium converter for grams, teaspoons and milligrams
- Source breakdown showing packaged, restaurant and salt-shaker share
- Sodium-to-potassium molar ratio against the WHO-implied 1.0 target
- Like-for-like product swaps with the milligrams each one removes
Understanding Results
Formula
Five short calculations sit behind the results. The tally itself is addition; the interesting arithmetic is everything downstream of it:
Daily sodium (mg) = Σ (sodium per serving × servings)
Salt (g) = sodium (mg) × 2.542 ÷ 1,000
Teaspoons of salt = salt (g) ÷ 6
Na:K molar ratio = (sodium mg ÷ 22.99) ÷ (potassium mg ÷ 39.1)
Systolic change (mmHg) = (sodium cut ÷ 1,000) × 2.52 if hypertensive, × 1.04 if not
The 2.542 factor is fixed chemistry: sodium chloride is 39.34% sodium by mass, so every gram of salt carries 393.4 mg of sodium and every milligram of sodium implies 2.542 mg of salt. Worked example using the starter day the calculator opens with — instant oatmeal 220, milk 105, banana 1, two slices of white bread 290, deli turkey 570, a slice of American cheese 300, canned soup 890, plain pasta 1, jarred sauce 480, broccoli 41, and a quarter teaspoon of table salt 590 — sums to 3,488 mg. That is 8.9 g of salt, about 1.5 teaspoons, and 152% of the 2,300 mg ceiling. Potassium totals 2,206 mg, giving 151.7 mmol sodium against 56.4 mmol potassium and a ratio of 2.69. The blood-pressure coefficients come from the 2013 meta-analysis of 34 trials: a 100 mmol (2,300 mg) daily reduction lowered systolic pressure 5.8 mmHg in hypertensive adults and 2.4 mmHg in normotensive ones, which is 2.52 and 1.04 mmHg per 1,000 mg.
Reference Ranges & Interpretation
Three official daily limits exist and they do not agree. The American Heart Association names 1,500 mg as the ideal for most adults; the World Health Organization recommends under 2,000 mg(5 g of salt); the US Dietary Guidelines set a ceiling of 2,300 mg for everyone aged 14 and over, dropping to 1,800 mg for ages 9 to 13 and 1,500 mg for ages 4 to 8. Mean US adult intake sits at about 3,400 mg. The colour bands on the progress bar grade your day against whichever limit you selected: green under 80%, amber to 100%, orange to 150%, red beyond that.
The sodium-to-potassium ratio is the second reading, and for cardiovascular risk it is arguably the better one. WHO's paired targets — under 2,000 mg sodium and at least 3,510 mg potassium — imply a molar ratio near 1.0. Typical US diets land around 2.3 to 2.7. In the NHANES III follow-up the ratio predicted cardiovascular mortality more strongly than sodium counted alone, which means a baked potato (926 mg potassium, 17 mg sodium) improves your number without you removing a single grain of salt. Useful anchors for calibration: one slice of bread 145 mg, a slice of American cheese 300 mg, 2 oz of deli turkey 570 mg, a cup of canned soup 890 mg, a tablespoon of soy sauce 900 mg, a 6-inch cold-cut sub 1,500 mg, and a whole instant-ramen packet 1,600 mg.
Assumptions & Limitations
Food values are typical figures from USDA FoodData Central and published brand data, and the same product genuinely varies between manufacturers — canned soups run from 140 mg to over 900 mg per cup for what the shelf presents as the same item, so read the Nutrition Facts panel when one is available. Sodium is assumed to scale linearly with servings, which holds for packaged food but understates a restaurant meal where portion size and the cook's hand both move. The blood-pressure estimate is a population mean: roughly a quarter of adults are salt-resistant and barely respond, while salt-sensitive people — more common with age, in Black adults, and in anyone with chronic kidney disease — respond considerably more. This page measures dietary intake only; it says nothing about the sodium concentration in your blood, which is a different quantity handled by the corrected sodium calculator. Anyone on a heart-failure, dialysis, lithium or fluid-restriction regimen should follow the milligram figure their clinician set, and potassium-based salt substitutes are unsafe in advanced kidney disease or alongside potassium-sparing diuretics.
Complete Guide: Sodium Intake Calculator
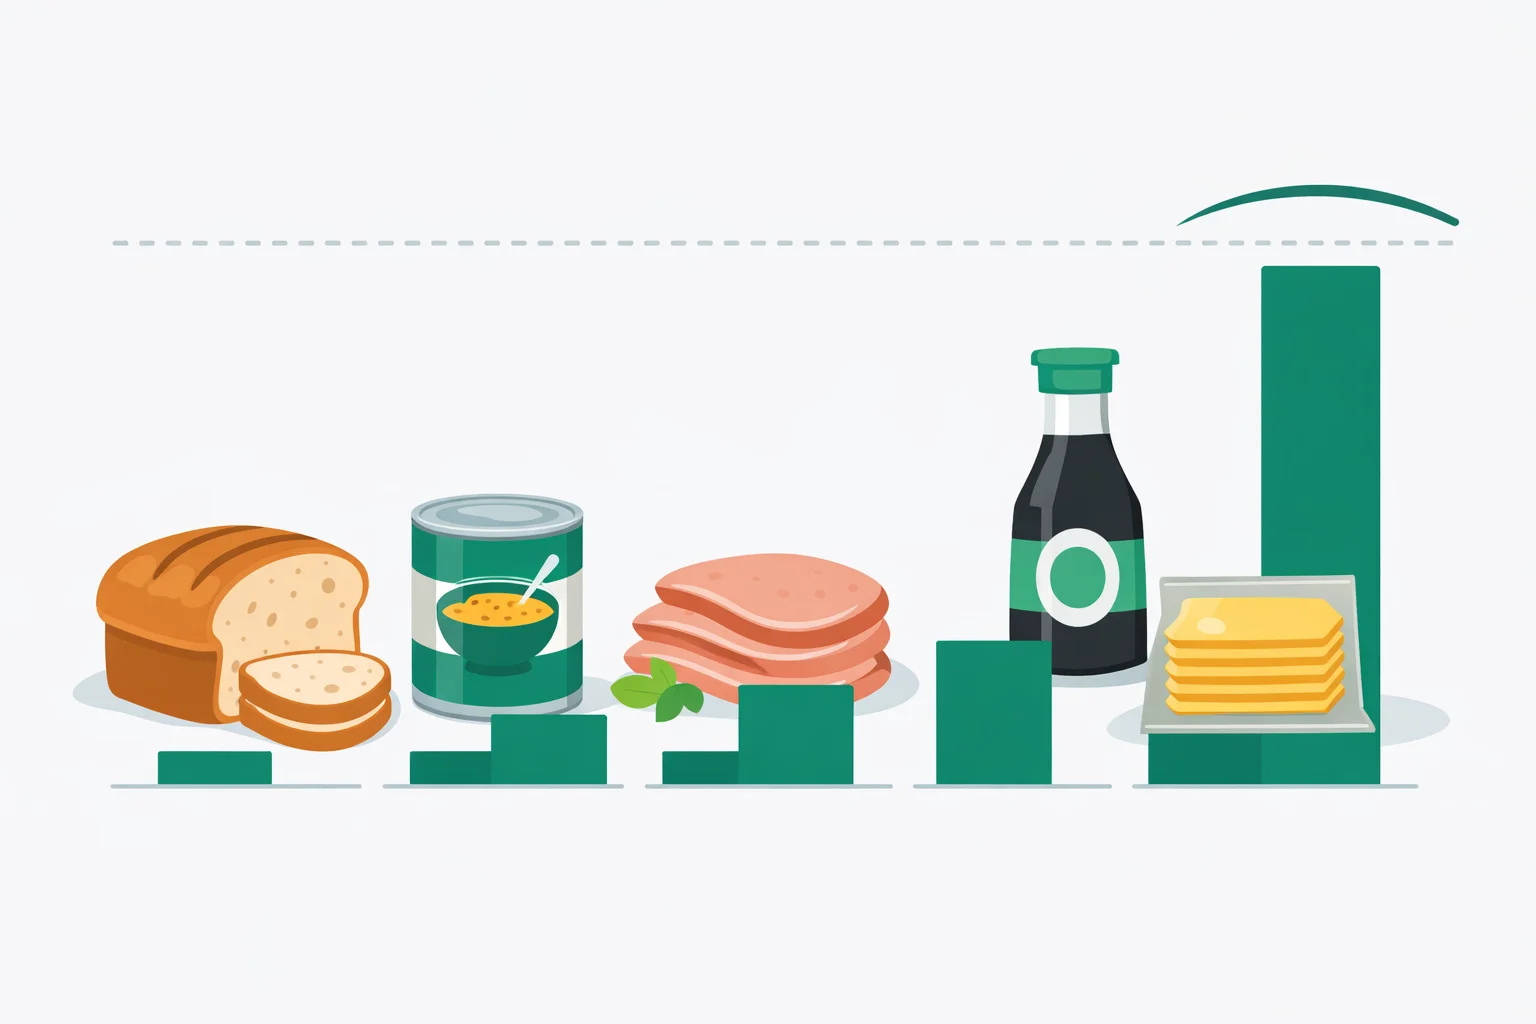
On this page
- 1,500 vs 2,000 vs 2,300: three limits that disagree
- Salt and sodium are not the same number
- Where 3,400 mg a day actually comes from
- Why saltiness is a terrible guide
- Sodium alone vs the sodium-to-potassium ratio
- What a 1,000 mg cut is worth in mmHg
- Four situations where a sodium intake calculator points at the wrong target
- What to do with your number
- References
Every sodium intake calculator rests on one fixed conversion, and it is the single fact that decides whether your arithmetic is right or wrong by a factor of two and a half: sodium chloride is 39.34% sodium by mass. One gram of table salt contains 393.4 mg of sodium. Run it the other way and 1 mg of sodium implies 2.542 mg of salt. A level teaspoon weighs about 6 g, which is 2,360 mg of sodium — and that is why the US limit of 2,300 mg gets described as "about a teaspoon of salt." Get that factor backwards, as food labels on two continents practically invite you to, and a perfectly ordinary lunch either looks catastrophic or looks fine. This guide covers which daily limit you should actually be measuring against, where the milligrams hide, and what cutting them is worth in millimetres of mercury.
1,500 vs 2,000 vs 2,300: three limits that disagree
Most articles quote one number and move on. There are three, they were set by different bodies answering different questions, and the gap between the loosest and the strictest is a 35% difference in what you are allowed to eat.
| Limit | Set by | The question it answers |
|---|---|---|
| 1,500 mg | American Heart Association | Below what level does blood pressure stop improving? Framed as an ideal, not a rule. |
| 2,000 mg | World Health Organization | What target is achievable population-wide, in countries where salt is the main preservative? |
| 2,300 mg | US Dietary Guidelines 2020–2025 | What is the highest intake still considered acceptable? A ceiling, explicitly not a goal. |
| 3,400 mg | — | What US adults actually eat. Roughly 1,100 mg above the loosest of the three. |
So which applies to you? The decision is short. If your blood pressure is at or above 130/80, or you take medication for it, aim at 1,500 mg — that group extracts about 2.4 times more systolic benefit from an identical reduction, so the stricter target is where the payoff is. If your pressure is normal and you are simply trying not to drift, 2,300 mg is the ceiling to stay under, with 2,000 mg as a sensible working aim. If a cardiologist or renal dietitian has handed you a figure — heart failure plans commonly specify 2,000 mg, some dialysis plans go lower — that number overrides all three, because it is balancing fluid retention rather than blood pressure alone. Children get their own scale: 1,500 mg for ages 4 to 8, 1,800 mg for 9 to 13, and the adult 2,300 mg from 14 upward.
One nuance worth holding on to: 2,300 mg is a ceiling. The Dietary Guidelines chose it partly because recommending 1,500 mg to a population currently eating 3,400 mg is not a plan anyone follows. Blood pressure keeps falling below 2,300 mg in trial after trial; the number is a compromise with reality, not a biological plateau.
Salt and sodium are not the same number
A US Nutrition Facts panel declares sodium in milligrams. A UK or EU panel declares salt in grams. They are describing the same food and the numbers differ by a factor of 2.542. A ready meal listing 1.5 g salt is carrying 590 mg of sodium; the same meal on a US shelf would print 590 mg and look, to anyone who has not done the conversion, like a completely different product.
- Salt (g) × 393.4 = sodium (mg). 5 g of salt → 1,967 mg sodium.
- Sodium (mg) × 2.542 = salt (mg). 2,300 mg sodium → 5.85 g salt.
- 1 level teaspoon of fine table salt ≈ 6 g ≈ 2,360 mg sodium. A quarter teaspoon is 590 mg — a quarter of the daily ceiling from one shake.
This is also where the pink-salt marketing collapses. Himalayan pink salt, Celtic sea salt and ordinary table salt are all 39 to 40% sodium by weight; the trace minerals that justify the price amount to well under 2% of the crystal and are nutritionally irrelevant at the milligram quantities involved. The one genuine difference is density. Coarse flakes pack loosely, so a teaspoon of flaky sea salt can hold 30 to 40% less sodium than a teaspoon of fine table salt — a real effect if you salt by the spoon, and one that vanishes the moment you weigh either of them on a scale.
Where 3,400 mg a day actually comes from
The salt shaker is a decoy. According to the CDC, more than 70% of dietary sodium in the US is already inside packaged and restaurant food before it reaches a kitchen. Roughly 14% occurs naturally in ingredients, and only about 5% is added while cooking with a further 5% at the table. Someone who removes the shaker from the table and changes nothing else has addressed a twentieth of the problem.
The CDC's ranking of the biggest contributors — often called the Salty Six — puts bread and rolls first, ahead of pizza, sandwiches, cold cuts and cured meats, soups, and burritos and tacos. Bread does not lead because it is salty; a slice holds about 145 mg, less than a tablespoon of ketchup and a fifth of a cup of canned soup. It leads because almost everyone eats several slices a day, every day. Frequency beats concentration, which is precisely why the calculator above tallies a whole day rather than looking up one food at a time. Add up a sandwich built from two slices of white bread, 2 oz of deli turkey and a slice of American cheese and you are at 1,160 mg before the mayonnaise — half the daily ceiling from something nobody would describe as a salty meal.
Why saltiness is a terrible guide
Perceived saltiness depends on how much sodium reaches your tongue at once, not how much is in the food. Sugar, fat and acidity all suppress salt perception, and a sodium load dissolved through a soft matrix registers far less than the same load sitting on a surface. Ranked by sodium per 100 g — a fairer comparison than per serving, because serving sizes flatter some foods enormously — the results are counter-intuitive:
| Food | Sodium per 100 g | Tastes salty? |
|---|---|---|
| Soy sauce | ~5,500 mg | Obviously |
| Bacon, cooked | ~2,200 mg | Yes |
| American processed cheese | ~1,430 mg | Mildly |
| Deli turkey breast | ~1,020 mg | Not really |
| White bread | ~520 mg | No |
| Potato chips | ~600 mg | Intensely |
| Cottage cheese | ~310 mg | No — it is marketed as a diet food |
| Breakfast cereal (corn flakes) | ~700 mg | No — the sugar masks it |
Look at the two rows people always get wrong. Potato chips carry roughly 600 mg per 100 g and cottage cheese about 310 mg — a gap of less than two to one, for foods that occupy opposite ends of the virtue spectrum. Corn flakes out-salt potato chips per 100 g outright, because sugar is one of the most effective salt-maskers there is. The chips taste salty because the crystals sit dry on the outside and hit your tongue undiluted; the cheese and the cereal deliver theirs dissolved and buffered. If your mental model of a low-sodium day is "nothing that tastes salty," you will build a 3,000 mg day and be surprised by the total.
Sodium alone vs the sodium-to-potassium ratio
Sodium and potassium work against each other at the kidney. Sodium pulls water into the bloodstream and raises volume; potassium promotes sodium excretion and relaxes vessel walls. Measuring one without the other throws away half the picture, which is why the calculator tracks both and reports the molar ratio: sodium mg divided by 22.99, over potassium mg divided by 39.1.
WHO's two recommendations — under 2,000 mg sodium and at least 3,510 mg potassium — imply a target ratio of about 1.0. Typical Western diets land between 2.3 and 2.7. In the NHANES III follow-up study, Cook and colleagues found the ratio predicted cardiovascular mortality more strongly than sodium counted on its own, and the practical consequence is genuinely liberating: you can improve your number by adding food rather than removing it. A baked potato with the skin brings 926 mg of potassium and 17 mg of sodium. A banana brings 422 mg against 1 mg. Half an avocado, 487 mg against 7 mg. Log the starter day in the calculator and then add one baked potato: sodium moves by 17 mg and the ratio falls from 2.69 to 1.90. Deleting the quarter-teaspoon of table salt instead — a 590 mg cut, seventeen times larger in sodium terms — only reaches 2.23. On this measure, adding one potato beats removing the salt shaker.
This is also the mechanism behind the DASH diet, which lowered systolic pressure by 5.5 mmHg without any sodium restriction at all — it simply loaded the plate with fruit, vegetables and low-fat dairy. If you are tracking the downstream number, the blood pressure calculator classifies a reading against the 2017 ACC/AHA thresholds.
What a 1,000 mg cut is worth in mmHg
Vague promises about "better heart health" are useless for deciding whether the effort is worth it, so here is the measured dose-response. He, Li and MacGregor pooled 34 randomised trials of at least four weeks and found that cutting 100 mmol of sodium per day — 2,300 mg — lowered systolic blood pressure by 5.8 mmHg in hypertensive adults and 2.4 mmHg in normotensive adults. Per 1,000 mg that is 2.52 and 1.04 mmHg, which is the coefficient the calculator applies.
The DASH-Sodium trial gives the shape of the curve rather than a single slope. Moving from a high-sodium control diet (about 3,450 mg) to a low one (about 1,150 mg) dropped systolic pressure 6.7 mmHg in hypertensive participants. Crucially, the step from the intermediate 2,300 mg level down to 1,150 mg produced a further 4.6 mmHg — the benefit did not flatten at 2,300 mg, which is the strongest single argument for the AHA's 1,500 mg figure. Each level was held for 30 days, and that is roughly the timeline to expect: most of the change appears within one to four weeks.
Two caveats keep this honest. These are population means, and salt sensitivity varies enormously — roughly a quarter of adults barely respond, while salt-sensitive individuals, more common with age, in Black adults and in anyone with chronic kidney disease, respond considerably more. And a 5 mmHg systolic reduction is not cosmetic: at population scale it maps to meaningful reductions in stroke and coronary events, which is why sodium reformulation is public-health policy rather than personal advice.
Four situations where a sodium intake calculator points at the wrong target
Several situations break the general guideline in both directions, and it is worth knowing which one you are in before you optimise hard against a number.
- Heart failure and dialysis. The constraint here is fluid retention, not blood pressure. Plans commonly specify 2,000 mg or less, and are often paired with a fluid restriction. Follow the prescribed figure.
- Chronic kidney disease. Sodium restriction improves proteinuria and the response to ACE inhibitors, but potassium-based salt substitutes are dangerous here — the same is true on spironolactone or any potassium-sparing diuretic, where a "low-sodium" salt can precipitate hyperkalaemia. Check where you sit with the CKD calculator before switching products.
- Endurance sport and heavy heat exposure. Sweat sodium concentration ranges from about 200 to 2,000 mg per litre between individuals. Someone losing 1.5 L an hour at the high end is shedding 3,000 mg in a single long session, and under-replacing it risks exercise-associated hyponatraemia. Pair your target with the hydration calculator rather than treating 2,300 mg as a hard cap on a hot training day.
- Postural hypotension, Addison's disease, POTS. Sodium is sometimes deliberately increased under supervision. General guidelines simply do not apply.
The PURE study deserves a straight answer because it comes up constantly. It reported higher cardiovascular risk below roughly 3,000 mg per day, which sounds like it overturns everything above. It estimated intake from a single fasting morning urine sample fed through the Kawasaki formula — a method that systematically overestimates low intakes and underestimates high ones — and it was observational, so people already ill and eating less of everything sit in the low-sodium group by construction. No randomised trial has demonstrated harm from reducing sodium to 1,500 mg. Treat the J-curve as an open question about very low intakes in sick populations, not as permission to ignore 3,400 mg.
What to do with your number
The calculator ranks your day by contribution for a reason: sodium reduction is a Pareto problem. In the starter day above, five like-for-like product swaps — low-sodium canned soup, roast chicken for deli turkey, Swiss for processed American cheese, no-salt-added pasta sauce, plain oats for the flavoured packet — remove 2,187 mg, taking a 3,488 mg day down to 1,301 mg. That is below even the AHA's 1,500 mg ideal, and not a single meal changed. Nobody ate a salad instead of a sandwich.
Three concrete moves, in order of return. First, replace the two or three highest rows in your contributor list with their reduced-sodium versions — canned goods, sauces, cured meat and processed cheese are where the manufacturer put the salt, and where the low-sodium version already exists on the same shelf. Second, drain and rinse canned beans and vegetables: rinsing removes roughly 40% of the sodium, and choosing no-salt-added removes about 96%. Third, add potassium rather than only subtracting sodium — a potato, a banana, a cup of beans — because the ratio moves on both terms. For the wider nutrient picture of any single food, the food nutrition calculator breaks down a full panel rather than sodium alone.
And give your palate three to four weeks. Salt taste receptors adapt: food that tastes flat at 1,500 mg in week one tastes normal by week four, at which point previously ordinary food starts tasting aggressively salty. That adaptation is the part no calculator can show you, and it is the reason most people who make the change do not go back.
References
- US Department of Agriculture and US Department of Health and Human Services. Dietary Guidelines for Americans, 2020–2025. Sodium limits by age and mean US intake.
- Centers for Disease Control and Prevention. Sodium and Health. Top food sources of sodium and the share contributed by packaged and restaurant food.
- World Health Organization. Guideline: Sodium intake for adults and children, 2012. The 2,000 mg sodium and 3,510 mg potassium recommendations.
- He FJ, Li J, MacGregor GA. Effect of longer term modest salt reduction on blood pressure: Cochrane systematic review and meta-analysis of randomised trials. BMJ 2013;346:f1325.
- Sacks FM, Svetkey LP, Vollmer WM, et al. Effects on blood pressure of reduced dietary sodium and the Dietary Approaches to Stop Hypertension (DASH) diet. New England Journal of Medicine 2001;344:3–10.
- Cook NR, Obarzanek E, Cutler JA, et al. Joint effects of sodium and potassium intake on subsequent cardiovascular disease: the Trials of Hypertension Prevention follow-up study. Archives of Internal Medicine 2009;169:32–40.
- US Department of Agriculture. FoodData Central. Sodium and potassium values per serving used in the food database above.

Written by Jurica Šinko
Founder & CEO
Entrepreneur and health information advocate, passionate about making health calculations accessible to everyone through intuitive digital tools.
View full profileFrequently Asked Questions
How much sodium per day is safe for an adult?
The US Dietary Guidelines set a ceiling of 2,300 mg per day for anyone aged 14 and over, the World Health Organization recommends staying under 2,000 mg, and the American Heart Association calls 1,500 mg the ideal for most adults. Average US intake is about 3,400 mg, so the typical adult is roughly 1,100 mg above the loosest of the three figures. If your blood pressure is raised, aim at 1,500 mg — that group gets about 2.4 times more benefit from the same reduction.
How much sodium is in one teaspoon of salt?
A level teaspoon of table salt weighs about 6 grams and delivers roughly 2,360 mg of sodium, which is why the FDA describes the 2,300 mg limit as "about a teaspoon." A quarter teaspoon is 590 mg, already a quarter of the daily ceiling. Coarse salts are less dense, so a teaspoon of kosher or flaky sea salt holds noticeably less by weight than a teaspoon of fine table salt.
Is 2,300 mg of sodium a lot in one day?
It is a ceiling, not a target — the highest amount considered acceptable, not the amount you should aim for. Around 2,300 mg most adults are still above the level at which blood pressure keeps improving, which is why the AHA sets 1,500 mg as the ideal. In practical terms 2,300 mg is one restaurant sandwich (about 1,500 mg) plus a cup of canned soup (about 890 mg), with nothing else all day.
How do you convert grams of salt into milligrams of sodium?
Multiply grams of salt by 393.4 to get milligrams of sodium, because sodium chloride is 39.34% sodium by mass. Going the other way, multiply sodium by 2.5 to get salt. So a European label reading 1.2 g salt per portion equals about 472 mg sodium, and a US label reading 800 mg sodium equals about 2 g of salt. Confusing the two numbers overstates your intake by a factor of 2.5.
Is sea salt or Himalayan pink salt lower in sodium than table salt?
No. By weight all three are 39 to 40% sodium — the trace minerals in pink and sea salt amount to well under 2% and change nothing nutritionally. The only real difference is crystal size: coarse flakes pack less densely, so a teaspoon of flaky sea salt can carry 30 to 40% less sodium than a teaspoon of fine table salt. Weigh them on a scale and that advantage disappears completely.
Which everyday foods carry the most hidden sodium?
The CDC ranks bread and rolls first, ahead of pizza, sandwiches, cold cuts and cured meats, soups, burritos and tacos, savoury snacks, chicken, cheese and eggs. Bread tops the list not because a slice is salty — it holds about 145 mg — but because people eat several slices a day. A single 6-inch cold-cut sub reaches around 1,500 mg, and one cup of canned chicken noodle soup about 890 mg.
How fast does blood pressure drop after cutting sodium?
Most of the change appears within one to four weeks. In the DASH-Sodium trial each sodium level was held for 30 days and blood pressure had clearly separated by the end of each period. Across 34 randomised trials, cutting 2,300 mg per day lowered systolic pressure by 5.8 mmHg in hypertensive adults and 2.4 mmHg in normotensive ones. Roughly a quarter of people are salt-resistant and barely move at all.
Can you eat too little sodium?
The body needs only about 500 mg a day to function, so genuine dietary deficiency is rare outside endurance sport, prolonged vomiting or diuretic use. Observational studies such as PURE report higher cardiovascular risk below roughly 3,000 mg, but they estimated intake from a single morning urine sample, a method that misreads low intakes — and reverse causation is likely, since sick people eat less of everything. No trial has shown harm from reducing sodium to 1,500 mg.
Related Calculators

BMR Calculator: Basal Metabolic Rate by Proven Formulas
Use our BMR calculator to estimate your basal metabolic rate using Mifflin–St Jeor or revised Harris–Benedict formulas. Choose metric or US units and see TDEE.
Caffeine Content Calculator — Coffee, Energy Drinks & Tea
Free caffeine content calculator showing how much caffeine is in coffee, espresso, tea, Red Bull, Monster and Celsius, plus your safe daily limit by weight.
Caffeine Half-Life Calculator: How Long Caffeine Lasts
Free caffeine half-life calculator showing how much caffeine is left at bedtime, your personal clearance rate, and the latest safe cutoff time to drink.
Calorie Calculator: Daily TDEE and Intake Estimate
Use our calorie calculator to estimate daily energy needs (TDEE) from age, sex, height, weight, and activity. See maintain, loss, and gain targets instantly.
Calorie Deficit Calculator — Set a Safe Daily Deficit
Use our calorie deficit calculator to set a safe daily calorie target. Estimate TDEE, choose a weekly weight-loss rate, and see deficit, timeline, and guidance.
Calorie Density Calculator: Calories per Gram of Food
Free calorie density calculator that turns calories and grams into kcal per gram, sorts any food into four energy density bands, and compares two foods.