Use the Sodium Correction Calculator
Free sodium correction calculator to adjust sodium for high glucose and plan a safe hyponatremia correction rate, with sodium deficit and saline volumes.
What do you need to calculate?
Adjusts a falsely low sodium reading in hyperglycemia (pseudohyponatremia).
Corrected Na
140 mEq/L
The reported (uncorrected) sodium from the lab panel.
Correction only applies when glucose is above 100 mg/dL.
Correction Factor (per 100 mg/dL glucose)
Hillier (2.4) is more accurate when glucose exceeds 400 mg/dL; Katz (1.6) is the classic factor.
Corrected Sodium
Grey marker = measured (128), black marker = corrected (140).
Formula: 128 + 2.4 × (600 − 100) / 100 = 140 mEq/L
Measured Na
128mEq/L
Moderate hyponatremiaAdjustment
+12mEq/L
Corrected Na
140mEq/L
Other factor (1.6)
136mEq/L
What this means
The measured sodium looks low, but once you account for glucose pulling water into the bloodstream, the corrected sodium is normal. This is translocational (dilutional) pseudohyponatremia — treating the hyperglycemia will normalize the sodium without salt.
Sodium Reference Ranges (Adults)
| Classification | Serum sodium |
|---|---|
| Severe hyponatremia | < 125 mEq/L |
| Moderate hyponatremia | 125–129 mEq/L |
| Mild hyponatremia | 130–134 mEq/L |
| Normal | 135–145 mEq/L |
| Hypernatremia | > 145 mEq/L |
Active row reflects the corrected sodium. Lab cutoffs vary slightly.
Disclaimer
This sodium correction calculator is for education only and does not replace clinical judgment. Hyponatremia and hypernatremia management depend on volume status, symptoms, chronicity, and frequent lab rechecks. Sodium correction must be supervised by a clinician; overly rapid correction can cause permanent neurological harm.
Your rating helps improve Sodium Correction Calculator. We store only an anonymized vote (no personal data).
How to Use Sodium Correction Calculator
Step 1: Choose what to calculate
Tap "Correct for Glucose" to unmask pseudohyponatremia, or "Hyponatremia Deficit & Rate" to plan a safe correction. The inputs change with the mode.
Step 2: Enter the lab values
For glucose correction, type the measured sodium (mEq/L) and serum glucose; switch glucose between mg/dL and mmol/L as needed. For the deficit mode, enter current sodium, weight, and planned 24-hour rise.
Step 3: Pick the correction factor
In glucose mode, choose Hillier (2.4) for glucose above 400 mg/dL or Katz (1.6) for the classic estimate. The calculator also shows the other factor for comparison.
Step 4: Set body water and fluid
In deficit mode, select sex and the elderly option to set the total body water fraction, then choose 3% or 0.9% saline for the Adrogué–Madias volume.
Step 5: Read the result and warnings
Review the corrected sodium or sodium deficit, the range bar, and any red overcorrection warning when the planned rise exceeds 8 mEq/L or sodium starts below 120.
Step 6: Copy your summary
Tap Copy Summary to save the sodium values, factor, deficit, and infusion rate to your clipboard for notes or handover.
Key Features
- Two modes: glucose correction and hyponatremia deficit & rate
- Katz (1.6) and Hillier (2.4) glucose correction factors compared
- Sodium deficit from total body water with sex and age adjustment
- Adrogué–Madias 3% and 0.9% saline volume and mL/h estimates
- Overcorrection and osmotic demyelination (ODS) safety warnings
- mg/dL and mmol/L glucose units with instant auto-calculation
Understanding Results
The Formulas Behind the Sodium Correction Calculator
This sodium correction calculator runs three equations depending on the mode. The glucose correction is Corrected Na = measured Na + factor × (glucose − 100) / 100, where the factor is 1.6 (Katz) or 2.4 (Hillier). The hyponatremia deficit is Na deficit = total body water × (target Na − current Na), with total body water set at 0.6, 0.5, or 0.45 × weight in kg by sex and age. The fluid volume comes from the Adrogué–Madias relation ΔNa per litre = (infusate Na − serum Na) / (total body water + 1), using 513 mEq/L for 3% saline and 154 mEq/L for 0.9% saline.
Reference Ranges & Interpretation
Normal serum sodium is 135–145 mEq/L. Below that, hyponatremia is graded mild (130–134), moderate (125–129), and severe (under 125); above 145 is hypernatremia. In glucose mode, the value to interpret is the corrected sodium — a measured 128 that corrects to 140 is not true hyponatremia. In deficit mode, the safety number is the planned 24-hour rise: keep it at 4–6 mEq/L and never above 8 mEq/L in average-risk patients, or 6 mEq/L when sodium starts below 105 or other ODS risks are present.
Assumptions & Limitations
Every formula here assumes a steady state that sick kidneys violate. The deficit equation treats the body as a closed container and ignores ongoing urinary water and sodium losses, which can make real sodium rise far faster than predicted — especially once dilute urine returns. The glucose factors are population estimates, not exact for any one patient. Use these numbers to support a clinician's plan with sodium rechecks every 2–4 hours; they do not replace bedside assessment of volume status, symptoms, and chronicity. This tool is educational and not medical advice.
Complete Guide: Sodium Correction Calculator
On this page
- Two different sodium corrections, one tool
- Sodium correction for glucose: Katz 1.6 vs Hillier 2.4
- Worked example: Na 128 with glucose 600
- The sodium deficit formula for hyponatremia
- Why the correction rate matters more than the deficit
- Adrogué–Madias: how much 3% saline to give
- Three mistakes that cause harm
- When each calculation applies
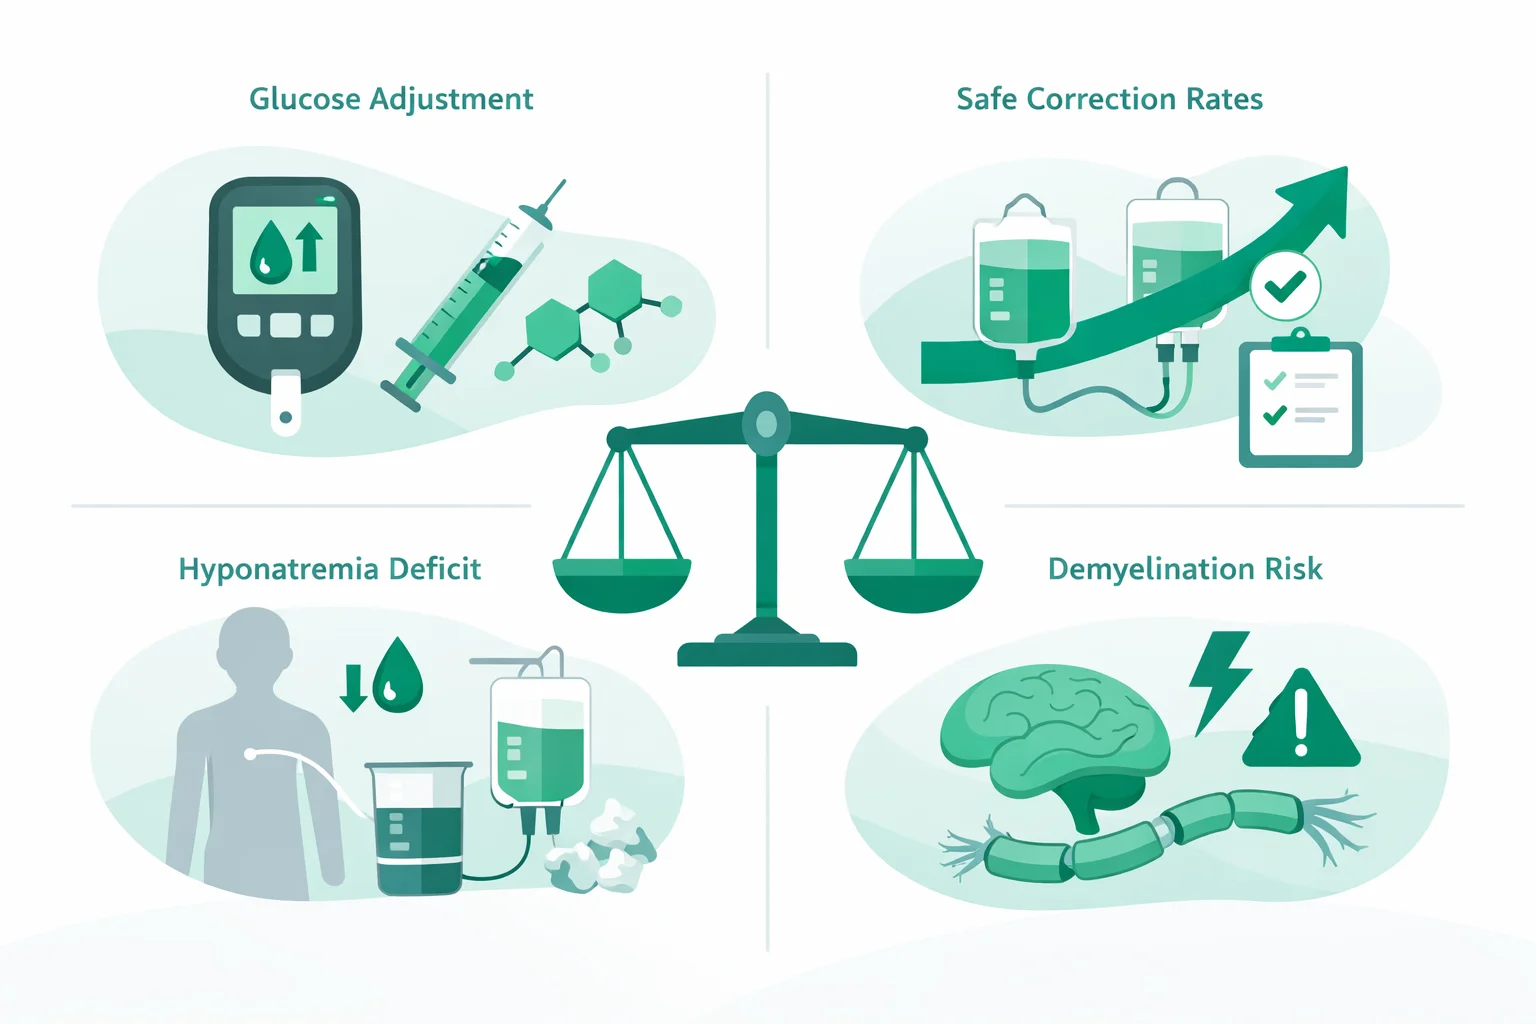
A sodium correction calculator solves two problems that look similar but pull in opposite directions: deciding whether a low sodium is real or just an artifact of high glucose, and figuring out how fast it is safe to raise a genuinely low sodium back toward normal. Confusing the two is dangerous. A reading of 128 mEq/L in a patient with a glucose of 600 mg/dL is usually not true hyponatremia at all — it is water shifting out of cells. Treat it with salt and you can overshoot badly. This guide separates the glucose correction from the deficit-and-rate calculation, walks through the actual numbers, and explains the 8-mEq-per-24-hour ceiling that keeps correction from causing osmotic demyelination.
Two Different Sodium Corrections, One Tool
The word “correction” means two unrelated things in sodium chemistry. The first is a read-out correction: hyperglycemia drags water into the bloodstream and dilutes sodium, so the lab number understates the true tonicity. You correct the number on paper, not the patient. The second is a treatment correction: when sodium is truly low, you calculate how much sodium the body is missing and, crucially, how slowly to replace it. The calculator above keeps these on separate tabs because the inputs and the dangers differ completely — the glucose tab needs a sodium and a glucose, while the hyponatremia tab needs weight, sex, and a target rise.
Sodium Correction for Glucose: Katz 1.6 vs Hillier 2.4
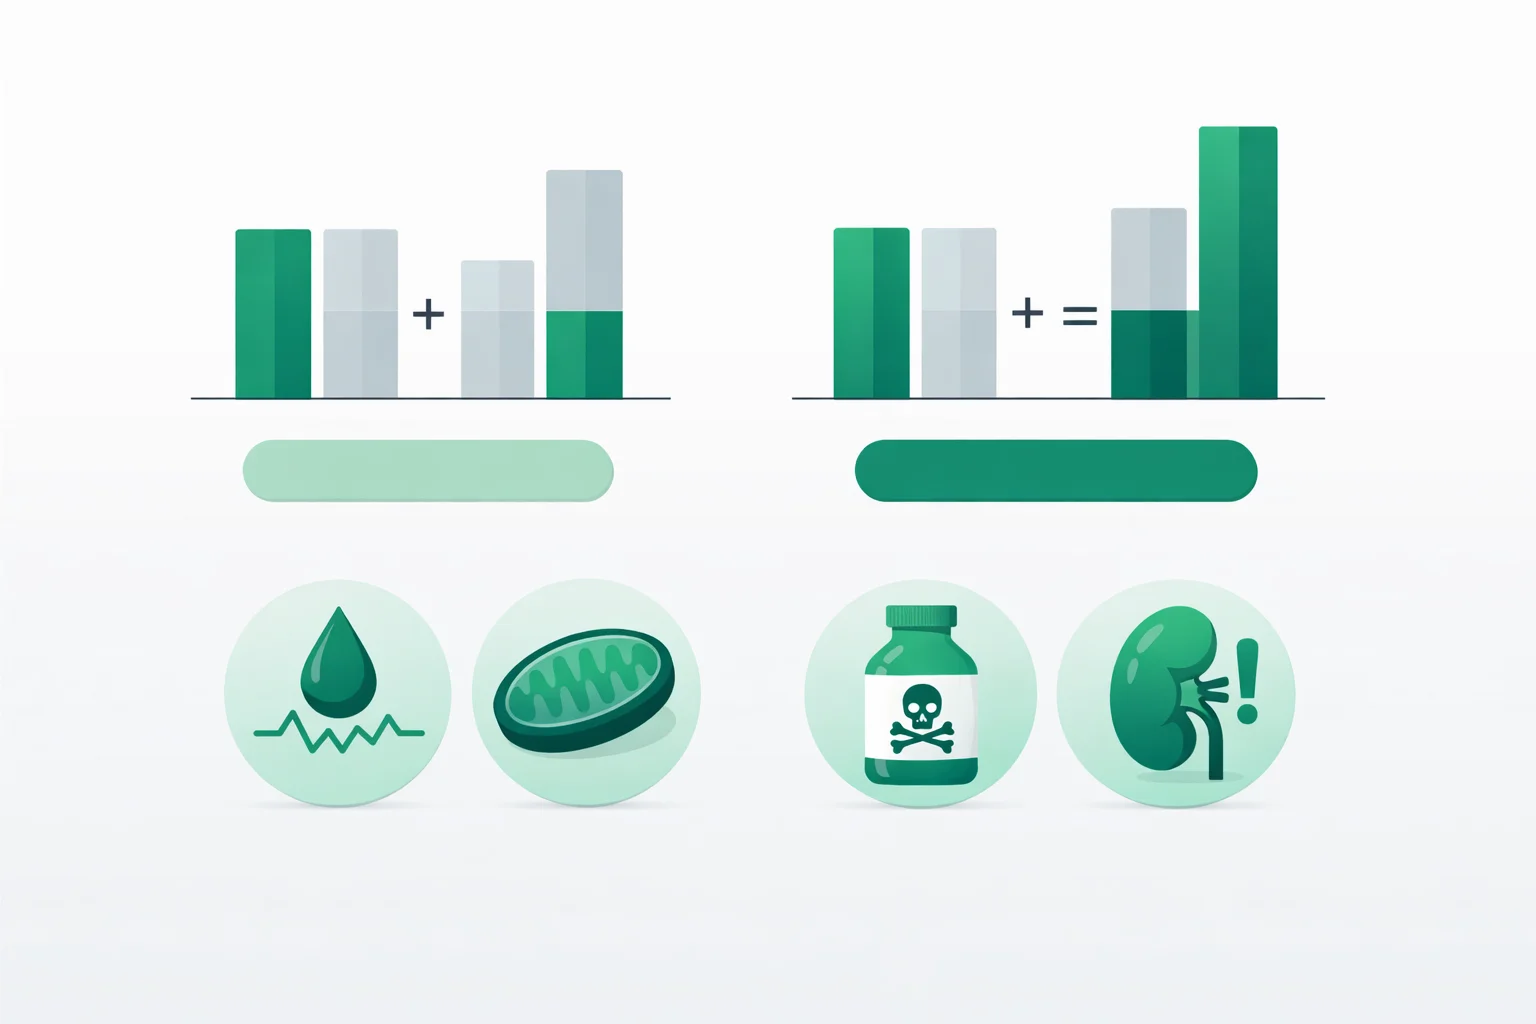
For every 100 mg/dL that glucose climbs above normal, serum sodium falls by a predictable amount. Two correction factors compete. The classic Katz factor (1.6) comes from a 1973 theoretical model. The Hillier factor (2.4) comes from a 1999 experimental study and tracks reality better at very high glucose. The formula is the same either way: Corrected Na = Measured Na + factor × (glucose − 100) / 100.
| Factor | Source | Best used when |
|---|---|---|
| 1.6 (Katz) | Theoretical, 1973 | Glucose 200–400 mg/dL; the traditional default |
| 2.4 (Hillier) | Experimental, 1999 | Glucose > 400 mg/dL; closer to measured values |
The gap between the two grows as glucose rises. At a glucose of 300, the difference is small — about 1.6 mEq/L. At a glucose of 1,000, the 2.4 factor adds 21.6 mEq/L versus 14.4 for the 1.6 factor, a 7-point spread that can flip a corrected sodium from “low” to “normal.” The calculator shows both so you never have to guess which the chart used. If you also want to see how the raw glucose itself reads across units, our blood glucose calculator converts mg/dL and mmol/L.
Worked Example: Na 128 With Glucose 600
A patient in diabetic ketoacidosis has a measured sodium of 128 mEq/L and glucose of 600 mg/dL. Using Hillier: 128 + 2.4 × (600 − 100) / 100 = 128 + 2.4 × 5 = 128 + 12 = 140 mEq/L. The “hyponatremia” vanishes. The true sodium is normal, and as insulin drives glucose down, the measured sodium will rise on its own toward 140 without any hypertonic saline. Miss this and you might wrongly diagnose hyponatremia, or worse, watch the “rising” sodium during treatment and panic about overcorrection that is really just the glucose effect reversing. The same osmotic logic that distorts sodium here also widens the gap between measured and effective osmolality — the kidney workup often pairs with an eGFR calculator check, since DKA and dehydration move creatinine too.
The Sodium Deficit Formula for Hyponatremia
When sodium is genuinely low, the deficit formula estimates the missing sodium: Sodium deficit (mEq) = total body water × (target Na − current Na). Total body water (TBW) is weight in kilograms multiplied by a fraction that depends on body composition: roughly 0.6 for adult men, 0.5 for women and older men, and 0.45 for older women, because lean tissue holds more water than fat. A 70 kg man with a sodium of 118 who needs to reach 124 has a TBW of 42 L and a deficit of 42 × (124 − 118) = 252 mEq. That number sounds precise, but it is the less important half of the calculation. The deficit tells you the destination; the rate tells you whether you arrive safely.
Why the Correction Rate Matters More Than the Deficit
Raise sodium too fast in chronic hyponatremia and the brain, which has adapted to low tonicity by shedding osmolytes, cannot pull water back in quickly enough. The result is osmotic demyelination syndrome (ODS) — irreversible damage to the brainstem that appears days later as paralysis, difficulty swallowing, and locked-in syndrome. The guardrail is strict: most guidelines cap the rise at 8 mEq/L in any 24-hour period, and only 6 mEq/L in high-risk patients (sodium under 105, alcoholism, malnutrition, liver disease, hypokalemia). Aiming for a modest 4–6 mEq/L rise in the first day treats symptoms while leaving a safety buffer. The calculator flags any planned rise above 8, and warns separately when the starting sodium is below 120.
| 24-hour rise | Status |
|---|---|
| 4–6 mEq/L | Target zone — relieves symptoms, wide safety margin |
| 6–8 mEq/L | Acceptable ceiling in average-risk patients |
| > 8 mEq/L | Overcorrection — ODS risk; consider relowering |
Adrogué–Madias: How Much 3% Saline to Give
The deficit formula assumes the body is a closed bucket, which it is not — kidneys keep adding and removing water. The Adrogué–Madias formula sidesteps that by predicting how much one liter of a chosen fluid will move the sodium: change in Na = (infusate Na − serum Na) / (TBW + 1). Hypertonic 3% saline carries 513 mEq/L of sodium; normal 0.9% saline carries 154. For the 70 kg man at 118 mEq/L, one liter of 3% saline raises sodium by (513 − 118) / (42 + 1) = 395 / 43 = 9.2 mEq/L — already above the daily ceiling, which is exactly why 3% saline is given in small 100–150 mL boluses, not free-flowing liters. To raise sodium a safe 6 mEq/L, you would give about 0.65 L over 24 hours, roughly 27 mL/h. The calculator does this arithmetic for both fluids and converts it into an hourly rate.
Three Mistakes That Cause Harm
First, salting a glucose artifact: giving sodium for a corrected value that is actually normal stacks a real hypernatremia on top of treated hyperglycemia. Second, ignoring ongoing losses — once desmopressin or recovering kidneys start dumping dilute urine, sodium can shoot up far faster than any formula predicted, so the 8 mEq/L limit is monitored with sodium checks every 2–4 hours, not calculated once and forgotten. Third, trusting the deficit number as a prescription: it estimates the gap, but the safe path is small fluid increments with frequent rechecks, because every formula here assumes a steady state that sick kidneys violate. Because low albumin and high glucose both distort related lab values, the same correction mindset shows up in our corrected calcium calculator and the albumin-corrected option in our anion gap calculator.
When Each Calculation Applies
Use the glucose correction whenever sodium and glucose are both abnormal — DKA, hyperosmolar hyperglycemic state, or any glucose above 200 mg/dL with a borderline sodium. Use the deficit-and-rate calculation only after you have confirmed the hyponatremia is real (corrected sodium still low) and assessed volume status and chronicity. Acute hyponatremia under 48 hours old, or any patient seizing or comatose, is the exception to the slow-correction rule: a single 100–150 mL bolus of 3% saline to lift sodium 4–6 mEq/L quickly can be lifesaving, after which the same 8 mEq/L daily ceiling resumes. The numbers in this tool support a clinician’s decision; they never replace bedside assessment, frequent labs, and a clear read on how long the sodium has been low.
References
- Hillier TA, Abbott RD, Barrett EJ. Hyponatremia: evaluating the correction factor for hyperglycemia. Am J Med. PubMed 1999
- Adrogué HJ, Madias NE. Hyponatremia. N Engl J Med. NEJM 2000

Written by Jurica Šinko
Founder & CEO
Entrepreneur and health information advocate, passionate about making health calculations accessible to everyone through intuitive digital tools.
View full profileFrequently Asked Questions
How do you correct sodium for high glucose?
Add a correction factor for every 100 mg/dL that glucose sits above 100. The formula is corrected sodium = measured sodium + factor times (glucose minus 100) divided by 100. For a sodium of 128 with glucose 600, using the 2.4 factor gives 128 + 2.4 x 5 = 140 mEq/L, a normal value.
Should I use the 1.6 or 2.4 sodium correction factor?
Use the 2.4 (Hillier) factor when glucose is above 400 mg/dL, where it matches measured sodium more closely. The 1.6 (Katz) factor is the older theoretical value and is reasonable for glucose between 200 and 400. The calculator shows both so you can compare.
What is the maximum safe rate to correct hyponatremia?
Most guidelines limit the rise to 8 mEq/L in any 24-hour period, and 6 mEq/L in high-risk patients (sodium under 105, alcoholism, malnutrition, or liver disease). Aiming for 4 to 6 mEq/L in the first day relieves symptoms while leaving a safety margin against osmotic demyelination.
How do you calculate a sodium deficit?
Sodium deficit in mEq equals total body water multiplied by the target sodium minus current sodium. Total body water is weight in kg times 0.6 for men or 0.5 for women. A 70 kg man going from 118 to 124 mEq/L needs 42 x 6 = 252 mEq of sodium.
What is osmotic demyelination syndrome?
Osmotic demyelination syndrome (ODS), formerly called central pontine myelinolysis, is irreversible brainstem injury caused by raising sodium too quickly in chronic hyponatremia. Symptoms such as paralysis and difficulty swallowing appear days later, which is why the rise is capped at 8 mEq/L per 24 hours.
How much does 3% saline raise sodium?
By the Adrogué-Madias formula, one liter of 3% saline (513 mEq/L) raises sodium by (513 minus current sodium) divided by (total body water plus 1). In a 70 kg man at 118 mEq/L that is about 9.2 mEq/L per liter, so 3% saline is given in 100 to 150 mL boluses, not full liters.
Is a sodium of 128 with high glucose true hyponatremia?
Often not. High glucose pulls water into the blood and dilutes sodium, so the reading understates the real value. Correct it first: if the corrected sodium is 135 to 145, the low number was translocational pseudohyponatremia and treating the glucose will normalize the sodium without salt.
What sodium level counts as severe hyponatremia?
A serum sodium below 125 mEq/L is classed as severe, 125 to 129 as moderate, and 130 to 134 as mild. Severe or symptomatic hyponatremia (seizures, coma) may need a rapid 4 to 6 mEq/L bolus of 3% saline, after which the slow 8 mEq/L daily ceiling resumes.
Related Calculators
A1C Calculator — Convert HbA1c to eAG with Targets
Use our A1C calculator to convert HbA1c to estimated average glucose (eAG). See normal, prediabetes, and diabetes thresholds in mg/dL and mmol/L. Fast results.

Albumin Calculator — Serum Albumin Level Interpretation
Free albumin calculator to interpret serum albumin levels, grade hypoalbuminemia, and compute A/G ratio plus albumin-corrected calcium from your lab results.
ANC Calculator — Free Neutrophil Count & Neutropenia Grade
Free ANC calculator: enter WBC and differential to get absolute neutrophil count in ×10^9/L and cells/µL with instant neutropenia grading and unit conversion.
Anion Gap Calculator — Metabolic Acidosis Evaluation
Free anion gap calculator finds serum anion gap from sodium, chloride, and bicarbonate, with albumin correction and delta ratio for metabolic acidosis.
AST/ALT Ratio Calculator — Free De Ritis Ratio Tool
Use our free AST/ALT ratio calculator to compute the De Ritis index instantly. Visual ratio chart, enzyme-level assessment, and clinical patterns guide.

Blood Pressure Calculator: Check BP Category by AHA
Use the blood pressure calculator to classify readings by AHA guidelines. See normal, elevated, and hypertension stages with explanations and practical tips.