Use the Resting Heart Rate Calculator
Free resting heart rate calculator comparing your pulse to normal ranges by age and sex, with athlete percentiles and what a high or low reading actually means.
Measured after 5 quiet minutes seated, or before getting out of bed.
Switch to months for babies and toddlers.
Women average 2–3 bpm higher at the same fitness level.
Don't know your pulse yet? Count your BPM here.
Your resting heart rate
Inside the conventional adult reference range used on every ECG report.
Rated against men aged 36–45. That is 1 bpm below the 71–75 bpm average for your age and sex.
Where 72 bpm sits on the male 36–45 scale
Dropping 2 bpm would move you from Average into Above average.
Beats per day
103,680
37.8 million a year
Average for 36–45
71–75 bpm
Men, midpoint 73
Athlete threshold
56 bpm or lower
Top band for your age and sex
Population mortality band — Copenhagen Male Study
71–80 bpm: 1.7×
16-year all-cause mortality hazard versus men resting at 50 bpm or below, adjusted for fitness and cardiovascular risk factors. A population association — not a prediction about you.
Resting heart rate chart — men, by age (bpm)
| Age | Athlete | Excellent | Good | Above average | Average | Below average | Poor |
|---|---|---|---|---|---|---|---|
| 18–25 | ≤ 55 | 56–61 | 62–65 | 66–69 | 70–73 | 74–81 | 82+ |
| 26–35 | ≤ 54 | 55–61 | 62–65 | 66–70 | 71–74 | 75–81 | 82+ |
| 36–45 | ≤ 56 | 57–62 | 63–66 | 67–70 | 71–75 | 76–82 | 83+ |
| 46–55 | ≤ 57 | 58–63 | 64–67 | 68–71 | 72–76 | 77–83 | 84+ |
| 56–65 | ≤ 56 | 57–61 | 62–67 | 68–71 | 72–75 | 76–81 | 82+ |
| 66+ | ≤ 55 | 56–61 | 62–65 | 66–69 | 70–73 | 74–79 | 80+ |
Fitness bands from Edwards, The Heart Rate Monitor Book. The 60–100 bpm clinical range is a separate, much wider yardstick — a 58 bpm reading is “bradycardic” on an ECG report and “Excellent” on this chart at the same time.
Not medical advice. This tool compares one resting pulse against published reference charts. It cannot detect atrial fibrillation, heart block or any other rhythm problem — those need an ECG. Seek care for a resting pulse that is persistently above 100 or below 50 bpm with symptoms such as dizziness, fainting, chest discomfort or breathlessness.
Educational tool, not medical advice. Check this tool’s method and limitations before interpreting a result. Talk to a qualified healthcare professional before making decisions about medication, diet, exercise, or treatment. See our Terms of Use.
Your rating helps improve Resting Heart Rate Calculator. We store only an anonymized vote (no personal data).
How to Use Resting Heart Rate Calculator
Step 1: Enter your resting pulse
Type your reading into the "Resting heart rate (bpm)" field. Count for a full 60 seconds after five quiet minutes seated, or measure in the first minute after waking before you sit up.
Step 2: Set your age
Enter your age in the "Age" field. Use the yr/mo toggle to switch to months for babies and toddlers, which loads the AHA pediatric ranges instead of the adult fitness chart.
Step 3: Choose male or female
Pick your sex. Female bands sit 2 to 3 bpm higher at every age, so the same 62 bpm reading can land two categories apart depending on which chart it is scored against.
Step 4: Read both labels
The result panel shows your fitness band (Athlete through Poor) next to your clinical band (bradycardia, normal sinus 60 to 100, or tachycardia). The two often disagree, and that is the point.
Step 5: Check the position bar and chart
The coloured bar shows exactly where your bpm falls between 40 and 100, and the full age chart highlights your row and cell so you can see how many beats separate you from the next band.
Key Features
- Seven fitness bands from Athlete to Poor, split by age bracket and sex
- Separate clinical read: bradycardia, normal sinus 60–100, or tachycardia
- AHA pediatric ranges for newborns through teens, awake and asleep
- Beats-per-day total and the exact gap to your next fitness band
- Copenhagen Male Study mortality band for your reading
Understanding Results
How the Resting Heart Rate Calculator Scores Your Reading
There is no equation to solve here — a resting pulse is a measured value, not a derived one. What the tool does is a two-way lookup. Your bpm is scored against the age- and sex-banded fitness chart from Edwards' The Heart Rate Monitor Book, which splits each age bracket into seven categories (Athlete, Excellent, Good, Above average, Average, Below average, Poor), and separately against the clinical 60–100 bpm sinus range used on ECG reports.
Two derived figures come out of it. Total beats per day is simply bpm × 1,440 — at 72 bpm that is 103,680 contractions a day, or 37.8 million a year. The “gap to next band” is your reading minus the upper bound of the band above it: at 74 bpm for a man aged 36–45, the Above-average ceiling is 70, so the gap is 4 bpm.
Below age 18 the tool abandons the adult chart entirely and switches to the American Heart Association's PALS pediatric bands, which are keyed to age in months and carry separate awake and sleeping ranges.
Reference Ranges & Interpretation
The clinical yardstick is deliberately wide: under 60 bpm is bradycardia, 60–100 is normal sinus rhythm, over 100 is tachycardia. These are diagnostic thresholds for rhythm disorders, not health targets, which is why a reading can be “normal” and unimpressive at the same time.
The fitness yardstick is much tighter and moves with age and sex. For men aged 36–45 the average band is 71–75 bpm and the athlete threshold is 56 bpm; for women the same age the average band is 74–78 bpm and the athlete threshold is 59 bpm. That 2–3 bpm sex offset reflects stroke volume, not fitness. Children sit on a different scale altogether — 100–205 bpm awake for a newborn, 75–118 for a school-age child, and only about 60–100 from age 12.
For outcome context, a CMAJ meta-analysis of 46 studies and over 1.2 million people found each 10 bpm rise in resting heart rate carried a 9% higher all-cause mortality risk, with no break at the edges of the “normal” range. The mortality band shown in the results comes from the Copenhagen Male Study (Jensen et al., Heart 2013).
Assumptions & Limitations
- One reading is not a baseline. Posture alone shifts a pulse 10–15 bpm between lying and standing, and a fever adds 8–10 bpm per 1 °C. Compare a run of morning readings, not two isolated numbers.
- Rate-slowing drugs invalidate the fitness bands. Beta blockers, diltiazem, verapamil, digoxin and donepezil lower resting rate by 10–20 bpm. An “Athlete” label on a beta blocker reflects the prescription, not conditioning.
- The Copenhagen mortality bands were measured in men only (2,798 participants, 16-year follow-up). They are a population association, not a personal prediction, and they should not be read as a risk score for any individual.
- Wearable “resting” values are not the same measurement. Most wrist devices report a low percentile of your sleeping heart rate, which reads several beats below a seated manual count. Do not mix the two when tracking a trend.
- Rate says nothing about rhythm. Atrial fibrillation, heart block and ectopic beats can all sit inside a perfectly normal average rate. Only an ECG can rule them out.
- Seek medical care for a resting pulse persistently above 100 or below 50 bpm with dizziness, fainting, chest discomfort, breathlessness or palpitations — or if your heart rate barely rises during exertion.
Complete Guide: Resting Heart Rate Calculator

On this page
- A pulse of 48 and a pulse of 88, both age 52
- Where the 60–100 range actually came from
- Resting heart rate by age: what really changes
- Why women read 2–3 bpm higher than men
- Is a low pulse athletic, or a problem?
- What moves your number, and by how much
- Most people measure it at the wrong moment
- How far can training actually drop it?
- References
A resting heart rate calculator settles a question the familiar 60-to-100 rule cannot answer. In the Copenhagen Male Study, which tracked 2,798 men for 16 years, those whose resting pulse sat between 81 and 90 beats per minute died at twice the rate of men resting at 50 bpm or below — and 81 to 90 is squarely inside “normal.” A pulse of 88 does not earn a single flag on an ECG report. It is still the highest-risk reading most people will ever be told is fine.
That gap is what this page exists to close. The tool above does not measure your pulse and it does not build training zones. It takes one number you already have and places it on two different yardsticks at once: the clinical 60–100 window every doctor uses, and the age- and sex-banded fitness chart that tells you whether 68 bpm is impressive or ordinary for a 44-year-old woman.
A pulse of 48 and a pulse of 88, both age 52
Take two men, both 52, sitting in the same waiting room. The first counts 48 beats in a minute. The second counts 88. Run both through the chart for men aged 46–55 and you get answers that no single “normal range” could have produced.
The 48 bpm reading falls below the clinical floor of 60, so an ECG technician would type “sinus bradycardia” on the report. On the fitness chart it lands under the 57 bpm athlete threshold for his age band — the top of seven categories. Two labels, one heartbeat, and they point in opposite directions. The label that matters depends entirely on a question the number cannot answer on its own: does he train, and does he feel fine? That is the decision framework further down this page.
The 88 bpm reading is the more interesting one. It sits comfortably inside 60–100, so nothing gets flagged. But the average band for men 46–55 is 72–76 bpm, which puts him 14 beats above typical and in the bottom of the seven categories. At 88 bpm his heart beats 126,720 times a day; the man at 48 bpm logs 69,120. Over a year that is a difference of about 21 million contractions.
Where the 60–100 range actually came from
The 60–100 bpm range is not an optimum. It is a pair of diagnostic thresholds — the points at which a cardiologist starts calling a rhythm bradycardic or tachycardic — and it was drawn from convenience rather than from outcome data. It is a wide net designed to catch rhythm disorders, not a target to aim for.
Epidemiology tells a different story about the same numbers. A meta-analysis in the Canadian Medical Association Journal pooling 46 studies and more than 1.2 million participants found that every 10 bpm increase in resting heart rate carried a 9% higher risk of all-cause death and an 8% higher risk of cardiovascular death. Nothing in that relationship stops politely at 100 and starts at 60. It runs straight through the middle of the “normal” range, which is why a calculator that only tells you whether you are inside 60–100 has told you almost nothing.
Practically, that means two thresholds are worth knowing rather than one. Below 50 or above 100 with symptoms is a reason to see a clinician. Between roughly 50 and 70, with no symptoms, is where the outcome data is most favourable — and the 30 beats between 70 and 100 are the ones the textbook range quietly waves through.
Resting heart rate by age: what really changes
Most people assume resting pulse climbs steadily with age the way blood pressure does. It does not. Maximum heart rate falls hard — roughly 0.7 bpm per year under the Tanaka equation — but resting heart rate in adults is remarkably flat from the twenties into the sixties. Compare the chart rows in the tool above: the average band for men 18–25 is 70–73 bpm and for men 56–65 it is 72–75. Five decades, three beats.
Childhood is the exception, and it is a dramatic one. A newborn's awake resting rate runs 100–205 bpm; by school age it is 75–118; only at about 12 does the adult 60–100 window start to apply. This is why a parent measuring a toddler's pulse at 130 and comparing it to an adult chart panics for no reason — 130 sits well inside the 98–140 band for a two-year-old. Switch the age input to months and the tool swaps to the American Heart Association pediatric bands, including the separate sleeping ranges, which sit below the awake values at every age — by about 10 bpm at the floor and up to 45 bpm at the ceiling.
The flip side: because adult resting rate barely moves with age, almost all of the spread you see between two 50-year-olds is fitness, medication and health — not birthdays. A large tracker-based cohort of 92,457 adults put the population average near 65 bpm, with individual averages spread across a range several times wider than the effect of ageing. Your number is telling you about your conditioning, not your calendar. If you want the age-driven half of the picture, that lives in the max heart rate calculator, where the 0.7 bpm-per-year decline actually does dominate.
Why women read 2–3 bpm higher than men
At identical fitness, women's resting pulses run about 2–3 bpm faster, and the fitness chart bakes that in: the athlete threshold for men 26–35 is 54 bpm, for women in the same bracket it is 59. Judging a woman's 62 bpm against a male chart would drop her two whole categories for no physiological reason.
The mechanism is stroke volume. Cardiac output is heart rate multiplied by the blood ejected per beat. Women have, on average, smaller hearts and a smaller stroke volume, so delivering the same cardiac output requires more beats per minute. It is arithmetic, not a fitness deficit. Cycle phase adds a smaller layer on top: resting rate typically sits a few beats higher in the luteal phase than the follicular, which is enough to move a borderline reading across a band boundary if you happen to measure on the wrong week.
Is a low pulse athletic, or a problem?
This is the question every resting-pulse chart dodges. A reading of 46 bpm is either the best news on this page or the reason to book an appointment, and the number alone will not tell you which. Five questions separate physiologic bradycardia from the kind that needs a workup.
| Ask yourself | Athletic bradycardia | Get it checked |
|---|---|---|
| Do you train endurance 4+ hours a week? | Yes, and have for months | No, or you recently stopped |
| Any dizziness, fainting, brain fog or breathlessness at rest? | None | Any of them, even occasionally |
| Does your pulse climb normally when you push hard? | Yes — 130–160 bpm on a steep climb | Stays flat; you gas out at low effort |
| How did it appear? | Gradually, over months of training | New, over days or weeks |
| Rate-slowing medication? | None | Beta blocker, diltiazem, verapamil, digoxin, donepezil |
The third row does most of the work. Chronotropic competence — whether the heart can accelerate on demand — is what separates a strong, efficient heart from a conduction system that has stopped keeping up. A trained heart resting at 44 bpm still reaches 165 on a hill. A failing sinus node resting at 44 bpm struggles to reach 110, and that is what leaves someone breathless climbing a single flight of stairs.
One caveat worth naming: the “I train, so it is fine” logic breaks down under overtraining. A resting pulse that keeps dropping while performance, sleep and mood all deteriorate is not a fitness milestone. Track the trend against your own baseline — a sustained shift of more than about 5 bpm in either direction is more informative than any single morning's reading. Pairing that trend with beat-to-beat data makes it harder to fool: an elevated morning pulse alongside a suppressed reading in our heart rate variability calculator is a far stronger “back off” signal than either number alone.
What moves your number, and by how much
Resting heart rate is not a fixed trait. These are the levers, with rough magnitudes, so you can tell a real change from measurement noise:
- Fever: about 8–10 bpm for every 1 °C above normal — Liebermeister's rule. A 38.5 °C temperature alone can push a 68 bpm baseline past 80.
- Posture: standing adds roughly 10–15 bpm over lying down. Measuring seated on Monday and supine on Tuesday manufactures a “change” that never happened.
- Dehydration: plasma volume falls, so each beat moves less blood. Expect around 3 bpm per 1% of body mass lost. The daily water intake calculator sets the baseline that keeps this out of your readings.
- Alcohol: reliably raises overnight and next-morning resting rate by several bpm, one of the largest single-night effects visible in wearable data.
- Short sleep: one bad night adds roughly 2–5 bpm the following day.
- Caffeine: smaller than almost everyone expects. It raises blood pressure, which triggers a compensating baroreflex slowing, so net resting pulse often moves only a few bpm — sometimes down. If you want to know what you actually consumed, the caffeine content calculator has the per-drink numbers.
- Beta blockers: 10–20 bpm down. If you take one, your reading reflects the drug as much as your conditioning, and the fitness bands above do not apply cleanly.
- Incubating illness: resting rate commonly climbs 1–3 days before you feel symptoms. An unexplained 5–7 bpm jump with no training or alcohol behind it is often the first sign.
Most people measure it at the wrong moment
“Resting” is a stricter word than it sounds. It does not mean “not currently exercising.” It means a quiet, seated or lying baseline with nothing recent stimulating you. The gold standard is the first minute after waking, before you sit up — that reading is 5–10 bpm lower and far more repeatable than one taken mid-afternoon at your desk.
If you are measuring during the day, sit quietly for a full five minutes first, with your back supported and feet flat. Avoid it within an hour of coffee, within two hours of exercise, and while you have a full bladder — bladder distension alone nudges the rate up. Count for a full 60 seconds rather than counting 15 and multiplying by four; a one-beat miscount over 15 seconds becomes a four-beat error, which is enough to cross a band boundary on the chart above. If you would rather have something count for you, the pulse and BPM calculator does the timing, and this page interprets the result.
One more thing worth knowing about wrist wearables: the resting figure they report is usually a low percentile of your sleeping heart rate, not a seated waking measurement. It will read several beats below a manual count. That is not an error in either method — they are measuring different things. Just do not mix them when you compare week to week.
How far can training actually drop it?
Less than the internet promises, and it takes longer. Controlled endurance-training studies typically report reductions of about 5–10 bpm over 8–12 weeks in previously untrained adults. The 40-something readings you see quoted for professional cyclists reflect years of accumulated volume plus a genetic hand most people were not dealt. Going from 78 to 68 bpm in three months is a strong, realistic outcome, and it removes roughly 14,400 beats from every day.
The training that produces it is unglamorous: sustained easy aerobic work, which thickens the left ventricle and raises stroke volume so fewer beats deliver the same output. Interval sessions build peak power but move resting rate less. If you want to structure that easy work rather than guess at it, the heart rate zone calculator turns your resting rate into Karvonen training bands — the resting number you just measured is a direct input to that formula. To see the same conditioning expressed as a single fitness figure, the fitness age calculator combines resting pulse with activity and VO₂ max.
Whatever your number is today, record it. A single reading places you on a chart; a run of morning readings tells you which direction you are heading, and that trend is the part the population bands can never give you.
References
- Jensen MT, Suadicani P, Hein HO, Gyntelberg F. Elevated resting heart rate, physical fitness and all-cause mortality: a 16-year follow-up in the Copenhagen Male Study. Heart. 2013;99(12):882–887.
- Zhang D, Wang W, Li F. Association between resting heart rate and coronary artery disease, stroke, sudden death and noncardiovascular diseases: a meta-analysis. CMAJ. 2016;188(15):E384–E392.
- American Heart Association. All About Heart Rate (Pulse). Pediatric awake and sleeping ranges follow the AHA PALS vital-sign tables.
- Quer G, Gouda P, Galarnyk M, Topol EJ, Steinhubl SR. Inter- and intraindividual variability in daily resting heart rate and its associations with age, sex, sleep, BMI, and time of year. PLOS ONE. 2020;15(2):e0227709.
- Edwards S. The Heart Rate Monitor Book. Polar Electro Oy; 1993. Source of the age- and sex-banded fitness categories used in the chart above.
- National Heart, Lung, and Blood Institute. Arrhythmias.

Written by Jurica Šinko
Founder & CEO
Entrepreneur and health information advocate, passionate about making health calculations accessible to everyone through intuitive digital tools.
View full profileFrequently Asked Questions
What is a good resting heart rate for my age?
For adults a good resting heart rate sits between roughly 50 and 70 bpm, and age matters far less than most people expect: the average band for men aged 18 to 25 is 70 to 73 bpm, versus 72 to 75 bpm for men aged 56 to 65. What separates a good reading from an average one is conditioning, not birthdays. Enter your age and sex above to see all seven bands for your exact bracket.
Is a resting heart rate of 55 too low?
For most adults 55 bpm is not too low. It falls in the Excellent band for men aged 26 to 35 and in the Athlete band for women in the same bracket. A pulse under 60 only needs investigating when it comes with dizziness, fainting, breathlessness or unusual fatigue, or when your heart rate fails to climb properly during hard effort.
Is a resting heart rate of 90 bad?
Ninety bpm sits inside the textbook 60 to 100 range, so nothing gets flagged, but it lands in the bottom band of the fitness chart at every adult age. In the Copenhagen Male Study, men resting between 81 and 90 bpm had roughly twice the 16-year all-cause mortality of men at 50 bpm or below. It is not an emergency, but it is worth looking at conditioning, sleep, alcohol, anaemia and thyroid function.
What is a normal resting heart rate for a woman?
Women average 2 to 3 bpm higher than men at identical fitness, because a smaller stroke volume needs more beats to deliver the same cardiac output. For women aged 26 to 35 the average band is 73 to 76 bpm and the athlete threshold is 59 bpm, against 54 bpm for men the same age. Resting rate also runs a few beats higher in the luteal phase of the menstrual cycle.
What is a normal heart rate for a child by age?
Children run much faster than adults. A newborn awake at rest is 100 to 205 bpm, a toddler 98 to 140, a school-age child 75 to 118, and only around age 12 does the adult 60 to 100 range start to apply. Sleeping rates sit below the awake values at every age, by roughly 10 bpm at the floor and up to 45 bpm at the ceiling. Switch the age unit to months in the calculator to load the AHA pediatric bands.
Does resting heart rate increase with age?
Barely. Maximum heart rate falls about 0.7 bpm per year, but adult resting heart rate is nearly flat across five decades — the average band moves only from 70 to 73 bpm for men aged 18 to 25 up to 72 to 75 bpm for men aged 56 to 65. If your resting pulse has climbed 10 bpm over a few years, deconditioning, weight change, medication or an untreated condition explains it far better than ageing does.
How much can training actually lower my resting heart rate?
Controlled endurance-training studies typically report 5 to 10 bpm over 8 to 12 weeks in previously untrained adults, not the 20 bpm often claimed online. Sustained easy aerobic work does most of the lowering because it raises stroke volume; interval sessions build peak power but move resting rate less. Going from 78 to 68 bpm takes about 14,400 beats out of every day.
When is a resting heart rate dangerous enough to see a doctor?
See a clinician for a resting pulse persistently above 100 or below 50 that comes with dizziness, fainting, chest discomfort, breathlessness or palpitations. Also get checked if your heart rate barely rises during exertion, because losing that chronotropic response matters more than the resting number itself. No calculator can detect atrial fibrillation or heart block — those need an ECG.
Related Calculators
A1C Calculator — Convert HbA1c to eAG with Targets
Use our A1C calculator to convert HbA1c to estimated average glucose (eAG). See normal, prediabetes, and diabetes thresholds in mg/dL and mmol/L. Fast results.

Albumin Calculator — Serum Albumin Level Interpretation
Free albumin calculator to interpret serum albumin levels, grade hypoalbuminemia, and compute A/G ratio plus albumin-corrected calcium from your lab results.
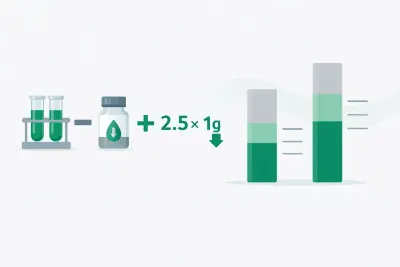
Albumin-Corrected Anion Gap Calculator — Hidden Acidosis
Use our albumin-corrected anion gap calculator to raise the anion gap by 2.5 per 1 g/dL of low albumin and reveal a hidden high-gap metabolic acidosis.

ANC Calculator: Absolute Neutrophil Count & Neutropenia
Free ANC calculator to calculate absolute neutrophil count from WBC and differential. Get ANC in cells/uL and x10^9/L with instant neutropenia grading.
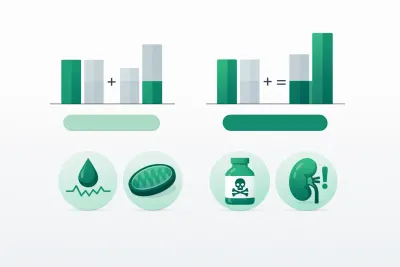
Anion Gap Calculator — Metabolic Acidosis Evaluation
Free anion gap calculator finds serum anion gap from sodium, chloride, and bicarbonate, with albumin correction and delta ratio for metabolic acidosis.
AST/ALT Ratio Calculator — Free De Ritis Ratio Tool
Use our free AST/ALT ratio calculator to compute the De Ritis index instantly. Visual ratio chart, enzyme-level assessment, and clinical patterns guide.