Use the Heart Rate Variability Calculator
Free heart rate variability calculator comparing your HRV in milliseconds to normal RMSSD ranges by age and sex, with recovery and training readiness guidance.
RMSSD
42 ms
≈ percentile
45th
Which number does your device report?
Use the overnight or morning value your app shows, not a mid-day spot reading.
Sex
Readiness check (optional)
Most apps show this as "baseline" or a 7-day trend line. Deviation from YOUR baseline predicts readiness far better than any population chart.
Your RMSSD of 42 ms at age 35 (male) is approximately the
45th percentile
Typical for your ageWithin the middle band for your age group. Absolute HRV varies about 5-fold between healthy people, so this says little on its own.
Typical range (30–39)
32–63 ms
Age-group median
45 ms
lnRMSSD (sports science)
3.7
Normal RMSSD by age (male) — 25th to 75th percentile
| Age | 25th | Median | 75th |
|---|---|---|---|
| 18–29 | 38 ms | 53 ms | 74 ms |
| 30–39 | 32 ms | 45 ms | 63 ms |
| 40–49 | 26 ms | 36 ms | 51 ms |
| 50–59 | 21 ms | 30 ms | 42 ms |
| 60–69 | 18 ms | 26 ms | 36 ms |
| 70+ | 16 ms | 23 ms | 32 ms |
Note: RMSSD and SDNN are different statistics — never compare an Apple Watch (SDNN) number to a Whoop or Oura (RMSSD) number. Percentiles here describe population position, not health status; HRV is best interpreted against your own baseline. This tool is educational and not a diagnostic device — persistent very low readings or irregular-rhythm warnings belong in a doctor's office.
Educational tool, not medical advice. Check this tool’s method and limitations before interpreting a result. Talk to a qualified healthcare professional before making decisions about medication, diet, exercise, or treatment. See our Terms of Use.
Your rating helps improve Heart Rate Variability Calculator. We store only an anonymized vote (no personal data).
How to Use Heart Rate Variability Calculator
Step 1: Pick your device metric
Choose RMSSD if your number comes from Whoop, Oura or Garmin, or SDNN if it comes from Apple Watch — the two statistics use different normal ranges.
Step 2: Enter your HRV in milliseconds
Type the overnight or morning HRV value your app shows into the Your HRV field. Avoid mid-day spot readings — they are not comparable to overnight averages.
Step 3: Add your age and sex
Enter your age (18+) and select male or female. HRV declines about 10% per decade, so the same value can be typical at 55 and low at 25.
Step 4: Optionally enter your 7-day baseline
Add the 7-day average from your app in the Readiness check field to see today’s deviation from your own baseline and a train / easy / recover signal.
Step 5: Read your percentile and range
The result shows your approximate percentile among age- and sex-matched peers, the typical 25th–75th percentile range, and the full normal HRV by age chart.
Key Features
- RMSSD and SDNN modes matched to Whoop, Oura, Garmin and Apple Watch
- Age- and sex-adjusted percentile from published population norms
- Normal HRV reference chart for ages 18 to 70+
- Baseline deviation check with training readiness guidance
- lnRMSSD score used in sports science monitoring
Understanding Results
Formula
The percentile comes from a log-normal fit of published heart rate variability norms. Within your age and sex bracket, the calculator takes the natural log of the bracket's median as the distribution center, derives the spread from the interquartile range (sigma = (ln P75 − ln P25) ÷ 1.349), computes your z-score as (ln HRV − ln median) ÷ sigma, and converts it to a percentile with the normal CDF. The optional readiness check is simpler: deviation % = (today − 7-day baseline) ÷ baseline × 100, flagged against a ±10% day-to-day noise band.
Reference Ranges & Interpretation
Typical short-term RMSSD spans roughly 38–74 ms at ages 18–29, 32–63 ms at 30–39, 26–51 ms at 40–49, 21–42 ms at 50–59 and 18–36 ms at 60–69 for men (25th–75th percentile), with women running 3–5 ms higher until about age 50. SDNN values read roughly 10–20 ms higher than RMSSD across all brackets. Ranges are synthesized from Shaffer & Ginsberg (2017, Frontiers in Public Health) and Voss et al. (2015, PLoS ONE). For readiness, a reading within ±10% of your baseline is noise, 10–20% below is a caution flag, and beyond 20% below is a strong recovery signal.
Assumptions & Limitations
Percentiles assume an overnight or resting morning measurement — mid-day spot readings taken upright or after caffeine are not comparable. RMSSD and SDNN are treated as separate metrics with separate tables and cannot be converted between one another. Population position is not a health verdict: absolute HRV varies about five-fold between healthy people, beta-blockers and antidepressants shift readings by 10–25%, and arrhythmias make optical HRV unreliable altogether. Persistent very low readings, irregular-rhythm alerts, or a suppressed baseline lasting months belong with a physician, not a training plan.
Complete Guide: Heart Rate Variability Calculator
Heart rate variability is the metric wearables get people most worked up about for the least reason. Someone sees a 38 ms reading on their Whoop, hears a training partner brag about 95 ms, and concludes their nervous system is broken. It isn't. Resting RMSSD in healthy adults spans roughly 20 to 100+ ms — a five-fold spread driven mostly by genetics, age and fiber-type lottery — which makes cross-person comparison close to meaningless. This heart rate variability calculator places your number against age- and sex-matched population percentiles so you know where you actually sit, then does the more useful thing: compares today's reading to your own 7-day baseline, which is the only comparison that predicts anything about your recovery.
Table of contents
- Why comparing your HRV to a friend's is meaningless
- RMSSD vs SDNN: which number your wearable actually shows
- Normal heart rate variability by age: the reference chart
- A worked percentile example: 42 ms at age 35
- Baseline deviation: the signal that actually predicts readiness
- What drags HRV down — with numbers
- When a low HRV is not a training problem
Why Comparing Your HRV to a Friend's Is Meaningless
Two healthy 30-year-olds who train identically can have resting RMSSD values of 35 ms and 90 ms. Neither is fitter, healthier or more recovered than the other. Twin studies attribute roughly 30–50% of resting HRV to heritable factors, and the rest splits across age, sex, training history, body position during measurement and even breathing rate at the moment of recording. Slow breathing at 6 breaths per minute can inflate RMSSD by 20–40% compared to breathing at 15 breaths per minute — same person, same morning.
What does carry signal is the trend within one person. Sports science groups working with elite endurance athletes — most prominently Plews and Buchheit — abandoned single-day absolute values years ago in favor of 7-day rolling averages of lnRMSSD (the natural log of RMSSD, which normalizes its skewed distribution). A suppressed rolling average predicted non-functional overreaching in triathletes before performance dropped. That's why the calculator above asks for your 7-day baseline: percentile answers "where am I in the population?", baseline deviation answers "should I train hard today?" — and only the second question changes what you do this morning.
RMSSD vs SDNN: Which Number Your Wearable Actually Shows
Here's the confusion that generates half the "why is my HRV so different on my new watch?" posts: different devices report different statistics under the same "HRV" label.
| Device | Metric reported | What it measures | When it's taken |
|---|---|---|---|
| Whoop | RMSSD | Beat-to-beat differences (vagal/parasympathetic tone) | Last slow-wave sleep episode |
| Oura Ring | RMSSD | Same, averaged in 5-min windows | Full night average |
| Garmin | RMSSD (overnight avg) | Same, shown as "HRV Status" vs personal baseline | Overnight |
| Apple Watch | SDNN | Total variability incl. sympathetic influence | Scattered daytime + night spot readings |
RMSSD (root mean square of successive differences) captures fast, breath-to-breath changes driven almost purely by the vagus nerve — it's the standard for recovery monitoring. SDNN (standard deviation of all normal beat intervals) mixes in slower oscillations and typically reads higher over long recordings. An Apple Watch SDNN of 55 ms and an Oura RMSSD of 40 ms can describe the same nervous system on the same night. The calculator handles this with separate percentile tables per metric — pick the toggle that matches your device and never mix the two in one trend line.
Normal Heart Rate Variability by Age: The Reference Chart
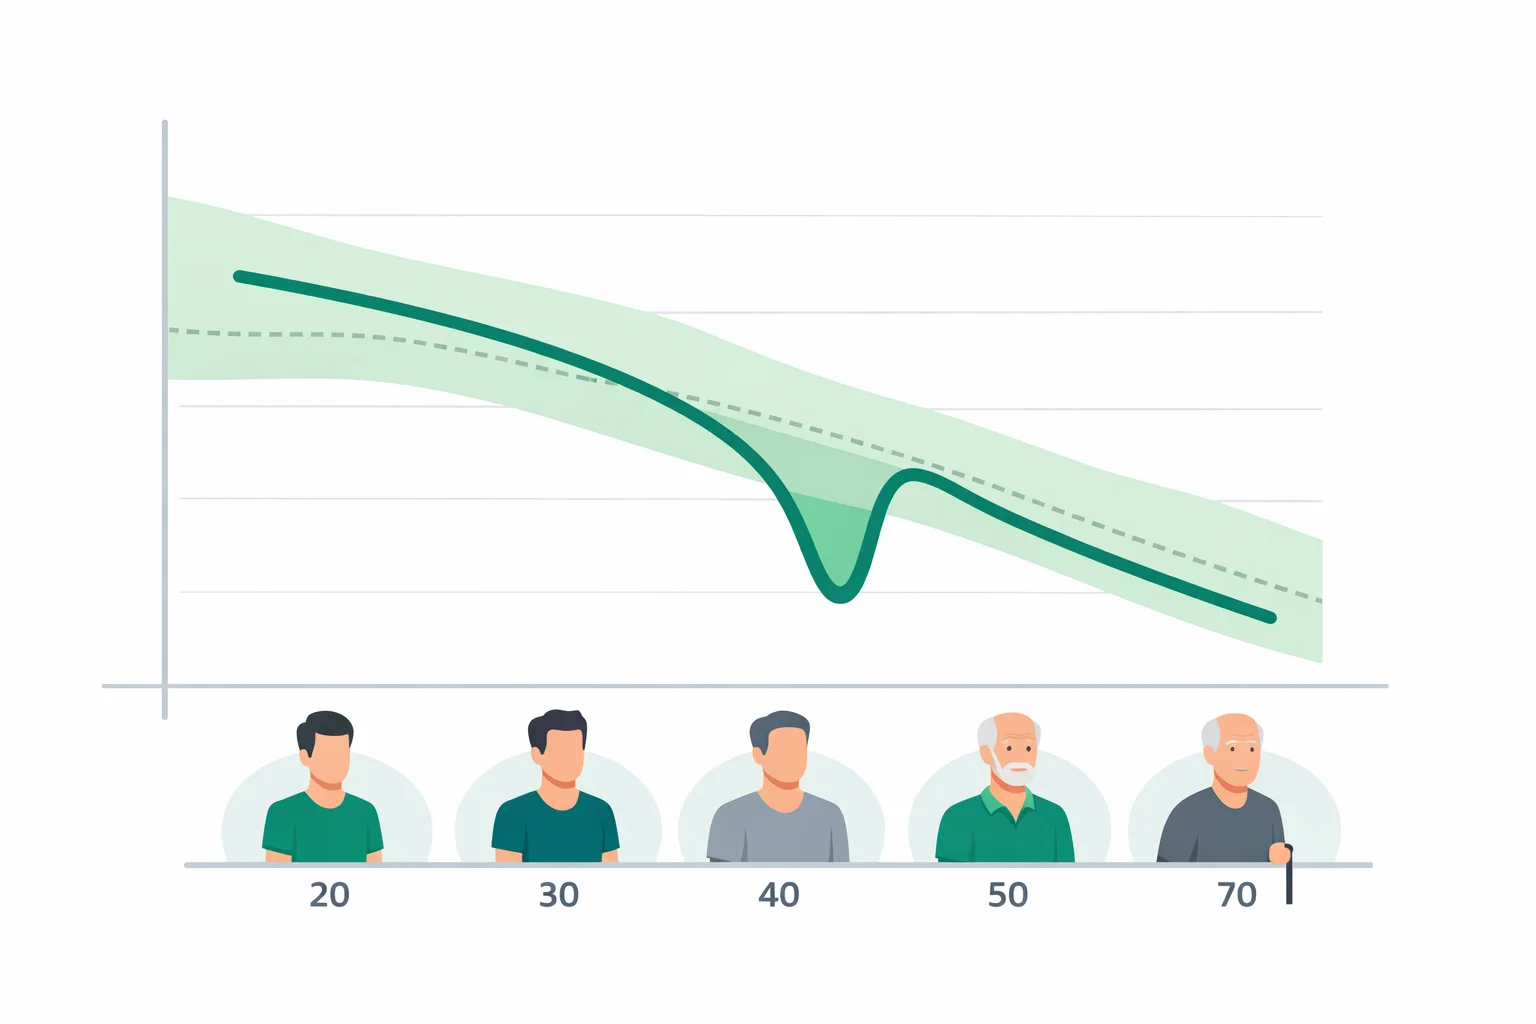
HRV declines steeply and predictably with age — faster than almost any other fitness marker. Median RMSSD drops from the mid-50s (ms) in your twenties to roughly half that by your fifties, a loss of about 10% per decade driven by stiffening of the sinoatrial node's autonomic response. This heart rate variability chart shows the middle 50% of the healthy population by age bracket, synthesized from the norms compiled by Shaffer & Ginsberg (2017) and the population study of Voss and colleagues (2015):
| Age | RMSSD — men (ms) | RMSSD — women (ms) | SDNN — both (ms) |
|---|---|---|---|
| 18–29 | 38–74 (median 53) | 42–79 (median 58) | 45–78 (median ~60) |
| 30–39 | 32–63 (median 45) | 35–66 (median 48) | 39–68 (median ~52) |
| 40–49 | 26–51 (median 36) | 28–53 (median 38) | 33–57 (median ~44) |
| 50–59 | 21–42 (median 30) | 22–42 (median 30) | 28–48 (median 37) |
| 60–69 | 18–36 (median 26) | 18–36 (median 26) | 24–42 (median 32) |
| 70+ | 16–32 (median 23) | 16–32 (median 23) | 21–37 (median 28) |
Two patterns worth noticing. Women run 3–5 ms higher RMSSD than men until about age 50, after which the sexes converge — estrogen enhances vagal tone, and the gap closes after menopause. And the ranges overlap heavily between adjacent brackets: a 55-year-old at 42 ms sits at the top of their bracket while a 25-year-old at the same 42 ms sits near the bottom of theirs. Age context changes the interpretation of an identical number, which is exactly why a good hrv score can't be defined by a single cutoff. If you're curious how your other cardiovascular markers stack up against your age, the fitness age calculator runs the same style of age-matched comparison across resting heart rate, VO2 max and more.
A Worked Percentile Example: 42 ms at Age 35
The calculator doesn't look your number up in a table — it fits a distribution. RMSSD is right-skewed (many people cluster at moderate values, a long tail stretches high), but its natural logarithm is close to normally distributed. So for a 35-year-old man, the math runs like this:
- Bracket 30–39 male: 25th percentile = 32 ms, median = 45 ms, 75th = 63 ms.
- Center of the log-normal fit: ln(45) = 3.81.
- Spread from the interquartile range: sigma = (ln 63 − ln 32) ÷ 1.349 = 0.68 ÷ 1.349 = 0.50.
- Your z-score for 42 ms: (ln 42 − 3.81) ÷ 0.50 = (3.74 − 3.81) ÷ 0.50 = −0.14.
- A z of −0.14 corresponds to roughly the 44th percentile — squarely typical.
That last step matters psychologically. A 35-year-old comparing their 42 ms against an influencer's 90 ms feels broken; against the actual population distribution, they're within a whisker of the median. The lognormal fit also explains why the same 8 ms drop means more at the low end: falling from 30 to 22 ms crosses more of the distribution than falling from 80 to 72 ms.
Baseline Deviation: The Signal That Actually Predicts Readiness
Day-to-day RMSSD fluctuates with a coefficient of variation around 10% even in perfectly healthy, well-rested people. That gives us a practical decision rule, and it's the one the calculator applies:
- Within ±10% of your 7-day baseline — noise. Train as planned.
- 10–20% below baseline — pay attention. One day means little; two or three consecutive days signal accumulating fatigue, short sleep or an incubating infection. Downgrade to an easy session.
- More than 20% below baseline — a strong stress response. Heavy alcohol, illness onset and brutal training blocks all produce drops of this size. Make it a recovery day.
- More than 10% above baseline — usually excellent recovery. The exception: a sudden large spike paired with an unusually low heart rate after extreme training can reflect parasympathetic saturation rather than fitness.
Pair the HRV trend with your morning pulse — the two together are far harder to fool than either alone. A suppressed HRV with an elevated resting heart rate is a much stronger "back off" signal than either flag by itself; you can track the second half of that pair with our resting heart rate calculator. And on days your baseline says you're ready, low-intensity aerobic work is what builds vagal tone in the first place — the Zone 2 heart rate calculator gives you the target range that raised resting RMSSD by 10–15% over 8–12 weeks in sedentary adults in training studies.
What Drags HRV Down — With Numbers
Not all HRV suppressors are equal. Ranked roughly by the size of the overnight hit:
- Alcohol: the heavyweight. Two or more drinks in the evening commonly cut overnight RMSSD by 20–35%, with the effect lingering into a second night after heavy sessions. Whoop's internal data made this famous; controlled studies agree.
- Acute illness: HRV often drops 2–3 days before symptoms appear — one of the few genuinely predictive uses of the metric.
- Hard training: a single high-intensity session suppresses RMSSD for 24–48 hours. That's normal adaptation, not a problem — the problem is when it stays suppressed across a full week.
- Sleep restriction: cutting sleep to 4–5 hours drops next-morning RMSSD by roughly 10–15% and stacks across consecutive nights.
- Late meals and dehydration: smaller effects, typically 5–10%, but they're the usual explanation for a mysteriously mediocre reading after an otherwise clean day.
On the flip side, the interventions with the best evidence for raising baseline HRV are aerobic base training, weight loss in people carrying excess visceral fat, and slow-breathing practice — each worth roughly 5–15% over weeks to months. Nothing moves it overnight except removing a suppressor.
When a Low HRV Is Not a Training Problem
A few situations break the recovery-monitoring frame entirely. Atrial fibrillation and frequent ectopic beats produce wildly erratic beat intervals that optical wearables misread as sky-high "variability" — an RMSSD reading above ~150 ms deserves suspicion, not celebration. Beta-blockers typically raise measured HRV while masking the stress response you're trying to monitor; stimulants and some antidepressants push it down 10–25% chronically. Type 2 diabetes progressively blunts HRV through autonomic neuropathy — one reason persistent very low readings across months warrant a conversation with a physician rather than another recovery week. And measurement context swamps everything: a spot reading taken standing, post-coffee, at 3 pm is not comparable to an overnight average, ever. Fix the measurement window before drawing any conclusion — overnight or first-thing-in-the-morning, same position, every day. Since maximum heart rate declines with age along the same autonomic aging curve, pairing your HRV percentile with the max heart rate calculator gives a fuller picture of where your cardiovascular ceiling and recovery capacity actually stand.
The bottom line fits in one sentence: measure at the same time daily, compare only to your own 7-day baseline, and treat a drop beyond 10% for multiple days — not any single number on any chart — as the cue to ease off.
References
- Shaffer F, Ginsberg JP. An Overview of Heart Rate Variability Metrics and Norms. Frontiers in Public Health. 2017;5:258.
- Voss A, Schroeder R, Heitmann A, Peters A, Perz S. Short-term heart rate variability — influence of gender and age in healthy subjects. PLoS ONE. 2015;10(3):e0118308.
- Plews DJ, Laursen PB, Stanley J, Kilding AE, Buchheit M. Training adaptation and heart rate variability in elite endurance athletes. Sports Medicine. 2013;43(9):773-781.

Written by Jurica Šinko
Founder & CEO
Entrepreneur and health information advocate, passionate about making health calculations accessible to everyone through intuitive digital tools.
View full profileFrequently Asked Questions
What is a good HRV for my age?
Median RMSSD runs about 53 ms in your twenties, 45 ms in your thirties, 36 ms in your forties and around 30 ms in your fifties, with the middle half of people spanning roughly 25th to 75th percentile bands about 20 ms wide. Anything inside that band is typical. Because healthy adults range five-fold (roughly 20 to 100+ ms), a stable value near your own baseline matters far more than beating the age median.
Is an HRV of 20 bad?
It depends heavily on age, device and trend. An RMSSD of 20 ms is near the 25th percentile for a 60-year-old but well below typical for a 25-year-old. If 20 ms is your stable everyday baseline and you feel fine, it may simply be your genetic set point. If it represents a drop of more than 20% from your usual baseline, treat it as a stress or illness signal, and if it persists for months alongside symptoms, mention it to a doctor.
Why is my Apple Watch HRV so different from my Whoop or Oura?
They measure different statistics. Apple Watch reports SDNN (total variability across a reading), while Whoop, Oura and Garmin report RMSSD (beat-to-beat vagal activity), and SDNN typically reads 10 to 20 ms higher. They also sample at different times — Apple takes scattered spot readings, the others average overnight. Never mix the two metrics in one trend line; compare each device only against itself.
What is a normal RMSSD score?
For healthy adults, short-term RMSSD commonly falls between about 20 and 90 ms, with age-group medians of 53 ms (18-29), 45 ms (30-39), 36 ms (40-49), 30 ms (50-59) and 26 ms (60-69) for men, and 3-5 ms higher for women under 50. Endurance athletes often sit above 80 ms, while values that are persistently under about 15 ms across many weeks are uncommon and worth a medical conversation.
Does alcohol lower HRV?
Yes, and by more than almost any other lifestyle factor. Two or more evening drinks commonly reduce overnight RMSSD by 20 to 35%, and after heavy drinking the suppression can persist into a second night. If your reading crashes the morning after drinking, that is the expected physiology, not a fitness change — expect it to normalize within 24 to 48 hours of abstinence.
How much does HRV decline with age?
Roughly 10% per decade. Median RMSSD falls from the mid-50s in milliseconds during your twenties to about half that by your fifties, one of the steepest age declines of any cardiovascular marker. Regular aerobic training slows but does not stop the decline — trained 60-year-olds often match the values of untrained 40-year-olds.
Can HRV be too high?
Sometimes. Readings above roughly 150 ms on an optical wearable deserve suspicion, because atrial fibrillation and frequent ectopic beats create erratic beat intervals that get misread as extreme variability. A sudden spike far above your baseline paired with an unusually low heart rate after a brutal training block can also indicate parasympathetic saturation rather than great recovery. In both cases, look at the raw trend and your symptoms rather than celebrating the number.
Related Calculators
5K Pace Calculator — Splits, Finish Time & Pace Zones
Train smarter with the 5K pace calculator: convert goal time to precise per-km and per-mile pace and split targets. Get fast, accurate results instantly.

Agility Calculator for T‑Test and Pro Agility (5‑10‑5)
Use our agility calculator to time T‑Test and pro agility shuttles, compare attempts, track change‑of‑direction speed, check asymmetry, and monitor progress.
Speed, Agility & Power — Athletic Performance Calculator
Analyze running pace, race predictions, strength 1RM, and jump power in one athletic performance calculator. Mobile‑first with quick inputs and clear results.
Bench Press Calculator — 1RM, Strength Level & Training
Free bench press calculator to estimate your one-rep max (1RM), compare strength standards by body weight and sex, and get percentage-based training loads.

Bench Press Calculator — 1RM Max, Sets & Plate Math
Use our bench press calculator to estimate your 1RM from reps and weight, auto‑build working sets, warm‑up ladder, and plate math in kg/lb. Mobile‑friendly.
Body Recomposition Calculator — Recomp Fat Loss & Muscle
Free body recomposition calculator projects fat loss and muscle gain month by month from your calories, protein, body fat and training age. Plan a real recomp.