Use the Albumin-Corrected Anion Gap Calculator
Use our albumin-corrected anion gap calculator to raise the anion gap by 2.5 per 1 g/dL of low albumin and reveal a hidden high-gap metabolic acidosis.
Corrected Anion Gap
14.8 mEq/L
Serum Electrolytes (mEq/L)
Use total CO₂ from your panel.
Normal reference is 4.0 g/dL (40 g/L). The formula adds 2.5 mEq/L of gap per 1 g/dL below it.
Albumin-Corrected Anion Gap
= 11 measured + 3.8 correction [2.5 × (4.0 − 2.5 g/dL)]
Hidden high gap unmasked: the measured gap of 11 mEq/L looks normal, but at an albumin of 2.5 g/dL it corrects to 14.8 mEq/L — a high-gap metabolic acidosis that hypoalbuminemia was concealing. Unmeasured acids (lactate, ketones, toxins, uremia) may be present.
Measured gap
11mEq/L
Correction
+3.8mEq/L
Albumin deficit
1.5g/dL
Acid-base
HCO₃ normal
Delta Ratio (corrected gap) = 1.4
Pure high-gap metabolic acidosis.
(Corrected gap − 12) ÷ (24 − bicarbonate). Using the corrected gap keeps the ratio honest when albumin is low.
How Albumin Level Changes Your Gap
Same electrolytes (measured gap 11 mEq/L), different albumin levels.
| Albumin (g/dL) | Gap hidden | Corrected gap |
|---|---|---|
| 4.0 | 0 mEq/L | 11 mEq/L |
| 3.5 | +1.3 mEq/L | 12.3 mEq/L |
| 3.0 | +2.5 mEq/L | 13.5 mEq/L |
| 2.5 ← yours | +3.8 mEq/L | 14.8 mEq/L |
| 2.0 | +5 mEq/L | 16 mEq/L |
| 1.5 | +6.3 mEq/L | 17.3 mEq/L |
| 1.0 | +7.5 mEq/L | 18.5 mEq/L |
Corrected values above 12 mEq/L appear in red — the acidosis threshold most labs use.
Disclaimer
This albumin-corrected anion gap calculator is for education only and does not replace clinical judgment, blood gas analysis, or laboratory interpretation. Acid-base disorders require a full clinical assessment. Always confirm results and treatment decisions with a healthcare professional.
Educational tool, not medical advice. Check this tool’s method and limitations before interpreting a result. Talk to a qualified healthcare professional before making decisions about medication, diet, exercise, or treatment. See our Terms of Use.
Your rating helps improve Albumin-Corrected Anion Gap Calculator. We store only an anonymized vote (no personal data).
How to Use Albumin-Corrected Anion Gap Calculator
Step 1: Enter sodium, chloride, and bicarbonate
Type the serum sodium, chloride, and bicarbonate (total CO2) from your metabolic panel in mEq/L.
Step 2: Enter serum albumin
Enter the albumin result and pick g/dL or g/L with the unit toggle; g/L values are converted automatically.
Step 3: Compare measured vs corrected gap
Read both bars against the 8-12 mEq/L normal band; the correction adds 2.5 mEq/L for every 1 g/dL of albumin below 4.0.
Step 4: Check the unmasking alert and delta ratio
An amber alert flags a high gap that low albumin was hiding, and the delta ratio computed on the corrected gap screens for mixed acid-base disorders.
Key Features
- Corrects the gap by 2.5 mEq/L per 1 g/dL of albumin below 4.0 g/dL
- Side-by-side measured vs corrected gap bars on the 8-12 normal band
- Amber alert when hypoalbuminemia is masking a high-gap acidosis
- Albumin accepted in g/dL or g/L with automatic conversion
- Delta ratio computed on the corrected gap for mixed disorders
- Albumin sensitivity table showing the gap hidden at each level
Understanding Results
Formula
The tool first computes the standard gap, Na − (Cl + HCO₃), then applies the albumin correction: corrected gap = measured gap + 2.5 × (4.0 − albumin in g/dL). Albumin is plasma's dominant unmeasured anion, and each 1 g/dL below the 4.0 g/dL reference conceals roughly 2.5 mEq/L of gap. If your lab reports albumin in g/L, the equivalent form is measured gap + 0.25 × (40 − albumin) — the unit toggle handles this automatically.
Reference Ranges & Interpretation
A normal potassium-free anion gap is 8–12 mEq/L, and the same thresholds apply to the corrected value. A corrected gap above 12 signals a high-gap metabolic acidosis (lactate, ketones, uremia, toxins) even when the measured gap looked normal — the exact blind spot Figge and colleagues described in critically ill patients in 1998 (Crit Care Med). At an albumin of 2.0 g/dL the correction adds 5 mEq/L; at 3.5 g/dL it adds only 1.3 mEq/L, so readings below about 3.0 g/dL are where reclassification usually happens.
Assumptions & Limitations
The 2.5 factor is calibrated to a pH of 7.4; albumin's charge rises in alkalemia and falls in acidemia, so extreme pH shifts the true factor slightly. The correction cannot see cationic paraproteins (multiple myeloma), lithium, or bromide, which narrow the gap by other mechanisms. Modern ion-selective analyzers often center the normal gap near 6–7 mEq/L rather than the textbook 10–12, so always interpret against your own laboratory's reference interval. This tool is educational and does not replace blood gas analysis or professional assessment.
Complete Guide: Albumin-Corrected Anion Gap Calculator
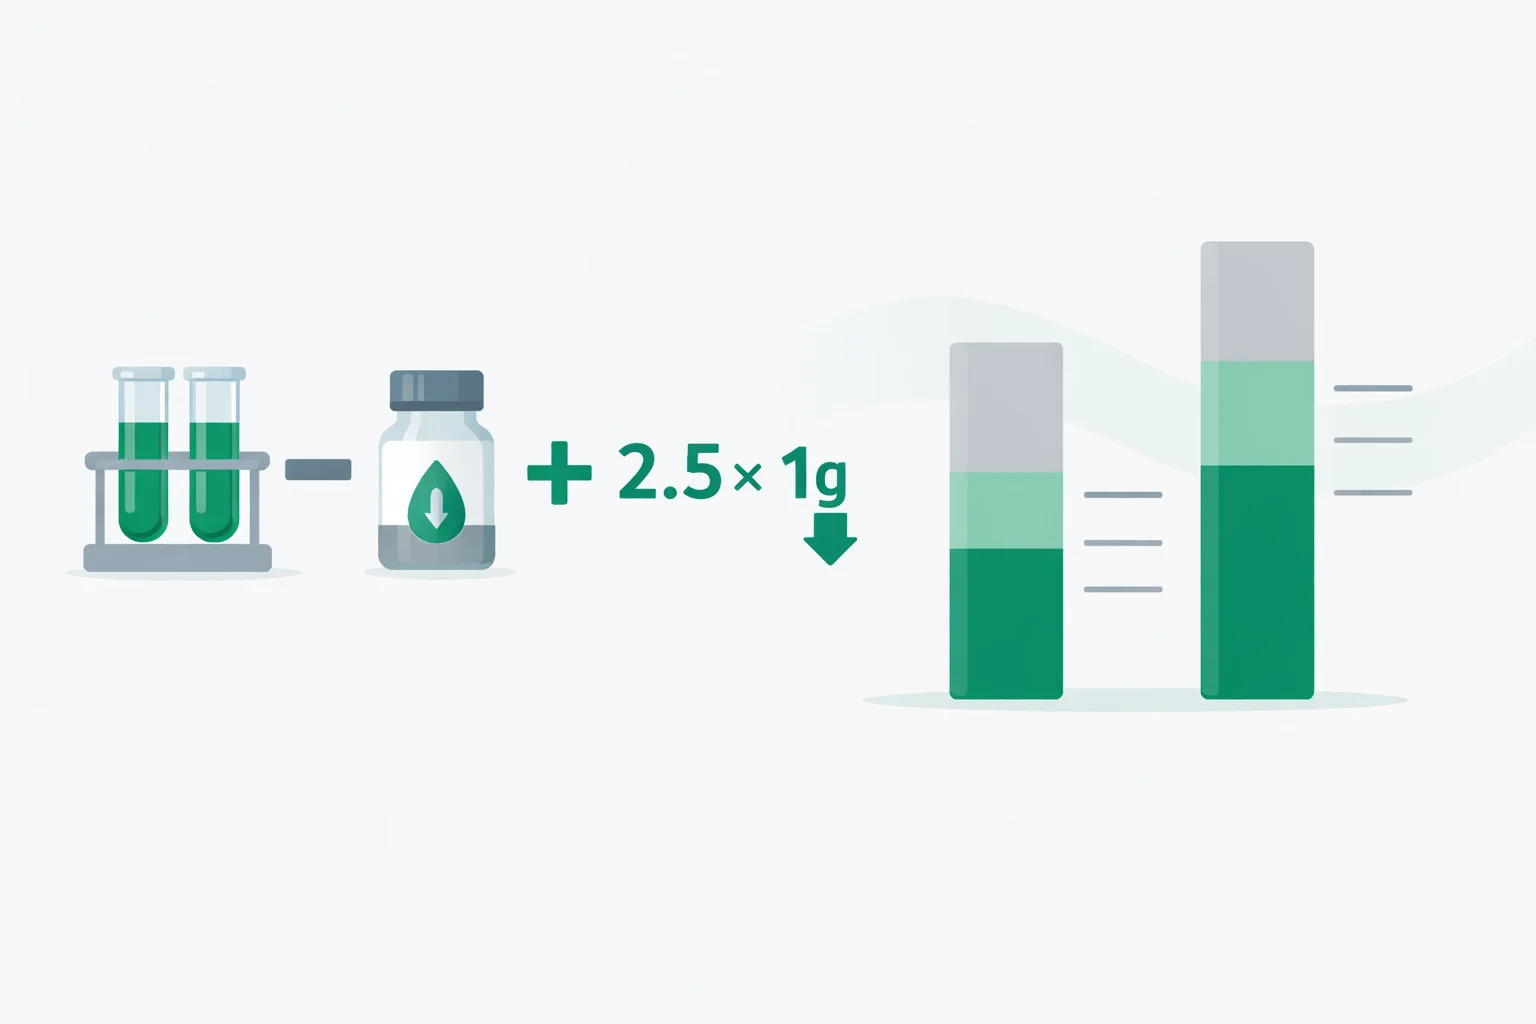
An albumin-corrected anion gap calculator runs one short formula: corrected gap = measured gap + 2.5 × (4.0 − albumin in g/dL). That single line exists to kill a dangerous assumption — that a "normal" anion gap rules out a high-gap metabolic acidosis. It doesn't. Albumin supplies most of the normal gap, so when albumin is low the gap reads low, and a patient quietly accumulating lactate or ketones can present with an anion gap of 10 that should really be read as 15. This guide covers where the 2.5 factor comes from, walks a full ICU case through the unmasking math, shows which conditions hide the most gap, and lists the unit traps that make the correction itself go wrong.
Table of contents
- Why a "normal" anion gap can lie
- Where 2.5 comes from: albumin's charge arithmetic
- A worked ICU case: measured 10, corrected 15.5
- Who actually needs the albumin-corrected anion gap calculator?
- The g/L trap and other ways the correction goes wrong
- When even the corrected gap misses
- What to do with a corrected gap of 16
Why a "Normal" Anion Gap Can Lie
The standard anion gap calculation — sodium minus chloride and bicarbonate — doesn't measure acids directly. It measures the space left over for unmeasured anions, and in healthy plasma roughly 75% of that space is one molecule: albumin. Kraut and Madias put the albumin contribution at about three quarters of the normal 8–12 mEq/L gap, with phosphate and other anions filling the rest. So the "normal range" printed next to your gap silently assumes a normal albumin of about 4.0 g/dL.
Break that assumption and the arithmetic breaks with it. A patient with an albumin of 1.5 g/dL starts from a baseline gap of about 5–6 mEq/L, not 10–11. Add 6 mEq/L of lactate to that patient and the measured gap lands at 11 or 12 — squarely "normal" — while a genuine high-gap acidosis is under way. The myth isn't that the anion gap is useless; it's that the uncorrected number can be trusted at any albumin level. Below about 3.0 g/dL, it can't.
Where 2.5 Comes From: Albumin's Charge Arithmetic
Albumin is a weak acid. At a physiologic pH of 7.4, each gram per deciliter of albumin carries roughly 2.3–2.8 mEq/L of negative charge. Figge and colleagues quantified this in critically ill patients in 1998 and proposed correcting the gap upward by 0.25 mEq/L for every 1 g/L of albumin below normal — the same statement as 2.5 mEq/L per 1 g/dL. Feldman's later analysis of 5,328 chemistry panels measured the real-world slope at about 2.3 mEq/L per 1 g/dL, close enough that the rounder 2.5 became the bedside standard. The same logic drives the corrected calcium calculator: albumin binds calcium and carries charge, so any lab value that leans on albumin needs an albumin-aware correction.
| Variant | Formula | Notes |
|---|---|---|
| Bedside standard | AG + 2.5 × (4.0 − albumin g/dL) | What this calculator uses |
| Figge original | AG + 0.25 × (44 − albumin g/L) | Anchors normal albumin at 4.4 g/dL |
| Feldman empirical | AG + 2.3 × (4.0 − albumin g/dL) | Measured slope from 5,328 lab panels |
Note the anchor disagreement: Figge's original normal albumin was 4.4 g/dL, while most bedside rules — and this calculator — use 4.0 g/dL. At an albumin of 2.0 g/dL, that choice shifts the corrected gap by 1 mEq/L (correction of +5.0 vs +6.0). It rarely changes the clinical call, but it explains why two references can print different "corrected" values for the same labs.
A Worked ICU Case: Measured 10, Corrected 15.5
A 68-year-old with cirrhosis is admitted with pneumonia. Chemistry: sodium 134, chloride 104, bicarbonate 20 mEq/L, albumin 1.8 g/dL. Step one, the measured gap: 134 − (104 + 20) = 10 mEq/L. Normal by every reference card. Step two, the albumin deficit: 4.0 − 1.8 = 2.2 g/dL. Step three, the hidden gap: 2.2 × 2.5 = 5.5 mEq/L. Step four, the corrected gap: 10 + 5.5 = 15.5 mEq/L — a high-gap metabolic acidosis, unmasked by one multiplication.
That reclassification changes the workup. A "normal-gap" acidosis with a bicarbonate of 20 points toward diarrhea or renal tubular acidosis; a high-gap acidosis demands a lactate, ketones, renal function, and — if the story fits — a toxic alcohol screen with the serum osmolality calculator and its osmolal gap. In this case the follow-up lactate came back at 4.8 mmol/L: early septic hypoperfusion that the uncorrected gap of 10 had filed under "nothing to see here." Plug the same numbers into the calculator above and it flags the unmasking automatically.
Who Actually Needs the Albumin-Corrected Anion Gap Calculator?
Anyone whose albumin sits below about 3.5 g/dL, which describes a remarkable share of hospitalized patients. Critical illness drives albumin down fast — capillary leak, dilution from fluids, and suppressed hepatic synthesis can drop it by 1–1.5 g/dL within days of ICU admission, which is exactly why Figge's correction was derived in an ICU population. The chronic culprits are cirrhosis (synthesis failure), nephrotic syndrome (urinary loss, often below 2.5 g/dL by definition), protein-losing enteropathy, severe burns, and malnutrition. If a low reading appears on routine labs, an albumin calculator helps interpret the level itself before you feed it into the gap correction.
| Condition | Typical albumin | Gap hidden |
|---|---|---|
| Sepsis / critical illness | 1.5–2.5 g/dL | +3.8 to +6.3 mEq/L |
| Decompensated cirrhosis | 2.0–3.0 g/dL | +2.5 to +5.0 mEq/L |
| Nephrotic syndrome | < 2.5 g/dL | > +3.8 mEq/L |
| Malnutrition / advanced age | 2.8–3.5 g/dL | +1.3 to +3.0 mEq/L |
Read the right-hand column as the size of the blind spot. A septic patient hiding 6 mEq/L of gap can bury an entire early lactic acidosis inside a "normal" result — which is precisely the population where catching it a few hours earlier matters most.
The g/L Trap and Other Ways the Correction Goes Wrong
The most common failure is a unit mix-up. Outside the US, labs report albumin in g/L, and plugging 25 g/L into a g/dL formula produces 2.5 × (4.0 − 25) = −52.5 mEq/L of "correction" — instantly, obviously wrong. The SI form of the rule is AG + 0.25 × (40 − albumin g/L), or simply divide by 10 first; the calculator's g/L toggle does the conversion for you. Three subtler mistakes are worth naming. First, correcting a potassium-inclusive gap against the potassium-free threshold of 12 — if your gap included potassium, the high cutoff is 16, not 12. Second, computing a delta ratio from the measured gap after classifying with the corrected one; the ratio should use the corrected gap, which is what this tool does. Third, expecting drama at mildly low albumin: at 3.5 g/dL the correction is a modest +1.3 mEq/L, and only readings below about 3.0 move most results across a decision line.
When Even the Corrected Gap Misses
The 2.5 factor is calibrated to a pH of 7.4. Albumin's charge shifts with pH — more negative in alkalemia, less in acidemia — so in severe acid-base derangement the fixed factor drifts by a fraction of an mEq/L per 0.1 pH unit. Cationic paraproteins in multiple myeloma narrow the gap through a mechanism albumin math can't see, and lithium, bromide, or severe hypercalcemia do the same. There's also an instrument problem: modern ion-selective analyzers often center the "normal" gap near 6–7 mEq/L rather than the textbook 10–12, so a corrected gap should always be judged against your own laboratory's reference interval, not a book value. The correction repairs one specific distortion — hypoalbuminemia — and none of the others.
What to Do With a Corrected Gap of 16
Treat it exactly as you would a measured gap of 16 in a patient with normal albumin: hunt for the acid. The GOLD MARK list covers the usual suspects — glycols, oxoproline, L-lactate, D-lactate, methanol, aspirin, renal failure, ketoacidosis — and the first-line labs are lactate, glucose with ketones, creatinine, and a salicylate level when ingestion is plausible. If the corrected gap and the bicarbonate drop don't move in step, the delta ratio printed by the calculator flags a mixed disorder worth a blood gas. And if the corrected gap is normal while bicarbonate is low, you've genuinely excluded the high-gap causes and can turn to the hyperchloremic differential with more confidence than the uncorrected number ever allowed. One number, one multiplication, and the blind spot closes.
References
- Figge J, Jabor A, Kazda A, Fencl V. Anion gap and hypoalbuminemia. Crit Care Med. 1998;26(11):1807–1810.
- Kraut JA, Madias NE. Serum anion gap: its uses and limitations in clinical medicine. Clin J Am Soc Nephrol. 2007;2(1):162–174.
- Feldman M, Soni N, Dickson B. Influence of hypoalbuminemia or hyperalbuminemia on the serum anion gap. J Lab Clin Med. 2005;146(6):317–320.

Written by Jurica Šinko
Founder & CEO
Entrepreneur and health information advocate, passionate about making health calculations accessible to everyone through intuitive digital tools.
View full profileFrequently Asked Questions
What is the formula for the albumin-corrected anion gap?
Corrected anion gap = measured anion gap + 2.5 x (4.0 - albumin in g/dL). For example, a measured gap of 10 mEq/L with an albumin of 2.0 g/dL corrects to 10 + 2.5 x 2.0 = 15 mEq/L. If your lab reports albumin in g/L, the equivalent form is measured gap + 0.25 x (40 - albumin).
Is an anion gap of 11 normal if albumin is 2.0 g/dL?
No - it is high once corrected. An albumin of 2.0 g/dL hides 2.5 x (4.0 - 2.0) = 5 mEq/L of gap, so the corrected value is 16 mEq/L, well above the usual 12 mEq/L threshold. That result warrants checking lactate, ketones, and renal function rather than filing the gap as normal.
Why does low albumin lower the anion gap?
Albumin is the largest unmeasured anion in plasma and supplies roughly 75% of the normal gap. Each 1 g/dL of albumin carries about 2.3-2.8 mEq/L of negative charge at pH 7.4, so when albumin falls the measured gap shrinks even while acid is accumulating.
At what albumin level should the anion gap be corrected?
Correct whenever albumin sits below the 4.0 g/dL reference, but the correction only becomes decision-changing below about 3.0 g/dL. At an albumin of 3.5 g/dL it adds just 1.3 mEq/L, while at 2.0 g/dL it adds 5 mEq/L - enough to reclassify many apparently normal gaps as high.
Should I use 2.3 or 2.5 as the albumin correction factor?
The bedside standard is 2.5, from the 1998 Figge derivation of 0.25 mEq/L per g/L of albumin. A 2005 analysis of 5,328 chemistry panels by Feldman measured the real-world slope at about 2.3 mEq/L per g/dL. The two factors differ by only 0.4 mEq/L at an albumin of 2.0 g/dL, so they almost always give the same clinical answer.
How do I correct the anion gap when albumin is reported in g/L?
Use corrected gap = measured gap + 0.25 x (40 - albumin in g/L), or divide the g/L value by 10 to get g/dL first. An albumin of 25 g/L equals 2.5 g/dL and adds 2.5 x 1.5 = 3.75 mEq/L to the gap. Never plug a g/L value into the g/dL formula - that mistake produces a large negative correction that is obviously wrong.
Does the albumin correction change the delta ratio?
Yes. The delta ratio compares the rise in anion gap to the fall in bicarbonate, so an understated gap understates the ratio. With a corrected gap of 16 mEq/L and a bicarbonate of 18 mEq/L, the ratio is (16 - 12) / (24 - 18) = 0.67, suggesting a mixed acidosis - while the uncorrected gap might never have triggered the calculation at all.
Can the corrected anion gap be lower than the measured gap?
Yes. When albumin is above 4.0 g/dL the formula subtracts instead of adds: an albumin of 5.0 g/dL removes 2.5 mEq/L from the gap. Hyperalbuminemia - usually from dehydration and hemoconcentration - inflates the raw gap the same way hypoalbuminemia deflates it.
Related Calculators

A1C Calculator — Convert HbA1c to eAG with Targets
Use our A1C calculator to convert HbA1c to estimated average glucose (eAG). See normal, prediabetes, and diabetes thresholds in mg/dL and mmol/L. Fast results.

Albumin Calculator — Serum Albumin Level Interpretation
Free albumin calculator to interpret serum albumin levels, grade hypoalbuminemia, and compute A/G ratio plus albumin-corrected calcium from your lab results.

ANC Calculator: Absolute Neutrophil Count & Neutropenia
Free ANC calculator to calculate absolute neutrophil count from WBC and differential. Get ANC in cells/uL and x10^9/L with instant neutropenia grading.

Anion Gap Calculator — Metabolic Acidosis Evaluation
Free anion gap calculator finds serum anion gap from sodium, chloride, and bicarbonate, with albumin correction and delta ratio for metabolic acidosis.
AST/ALT Ratio Calculator — Free De Ritis Ratio Tool
Use our free AST/ALT ratio calculator to compute the De Ritis index instantly. Visual ratio chart, enzyme-level assessment, and clinical patterns guide.
Blood Pressure by Age Calculator: Normal Range Chart
Free blood pressure by age calculator: see your percentile among adults your age and sex, plus a normal range chart of average readings from age 18 to 85.