Use the PSQI Calculator
Free PSQI calculator that scores all 19 Pittsburgh Sleep Quality Index items into 7 components and a 0-21 global score, plus the poor sleeper cut-off above 5.
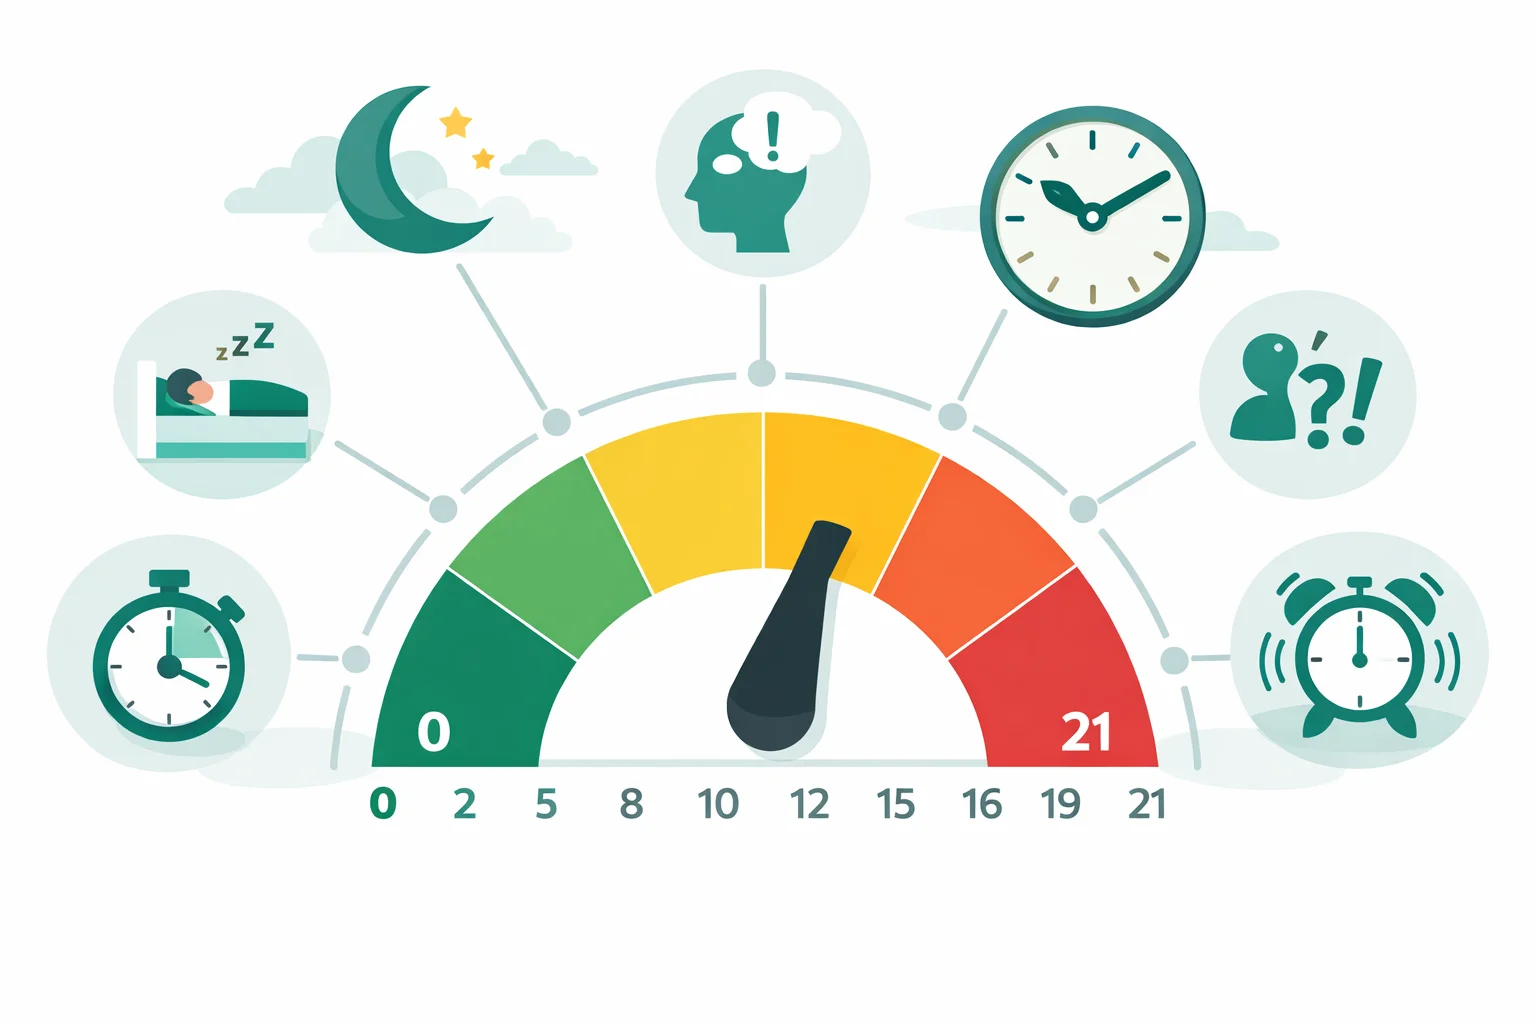
Global PSQI score (out of 21)
5 of 21 points · good sleeper
| 5 = cut-off| 10 = severe insomnia range
Answer for the past month only. Give the response that applies to the majority of days and nights, not to your best or worst week. All 19 items feed 7 component scores; the calculator shows each component as you go.
Your PSQI results
Global PSQI
5
out of 21
Classification
Good sleeper
cut-off is above 5
Components at 2 or 3
0 / 7
nothing severe
Your seven component scores
Two people can both score 9 and need completely different treatment. The profile below is what a clinician reads — the global number is only the sum of these seven bars.
Fairly good
20 min (1) + item 5a (0) = 1/6
6.5 h actual sleep
81.3% of 8h in bed
items 5b-5j sum to 0/27
Not during the past month
staying awake (0) + enthusiasm (1) = 1/6
No component scored above 1, so your 5 points are spread thinly rather than concentrated. That pattern is typical of a genuinely good sleeper having an ordinary month, not of a specific sleep problem.
| Global score | Classification | What it suggests |
|---|---|---|
| 0 - 4 | Good sleeper | Below the cut-off. Sleep quality is not the limiting factor in how you feel. |
| 5 | Good sleeper, sitting on the cut-off | Still classified good — the rule is greater than 5, not 5 or more. One point in any component tips it. |
| 6 - 10 | Poor sleeper, mild disturbance | Past the cut-off. Look at which components carry the points before changing anything. |
| 11 - 15 | Poor sleeper, moderate disturbance | Typical of untreated chronic insomnia. Worth a structured assessment rather than sleep hygiene tips. |
| 16 - 21 | Poor sleeper, severe disturbance | Severe across multiple domains. Bring this component profile to a clinician. |
Only the split at 5 comes from the original validation (Buysse 1989). The severity bands above 5 are the descriptive convention used in most trial reporting, not part of the published instrument.
Your global PSQI is 5 / 21, which classifies you as a good sleeper under the standard cut-off of greater than 5. Still classified good — the rule is greater than 5, not 5 or more. One point in any component tips it.
What the PSQI does not measure
The PSQI grades perceived sleep quality over a month. It does not measure daytime sleep propensity, and it does not screen for obstructive sleep apnoea — only one of its 19 items (5e, snoring) touches breathing at all. If you snore or wake unrefreshed despite adequate hours, run the STOP-BANG sleep apnoea screen. If the problem is nodding off during the day, the Epworth Sleepiness Scale measures that directly, and insomnia severity is a separate construct again.
This PSQI calculator is informational and does not diagnose a sleep disorder. A global score above 5 identifies you as a poor sleeper on a validated questionnaire — it does not name the cause. Nothing you enter leaves your browser. The Pittsburgh Sleep Quality Index is copyright the University of Pittsburgh; this tool reproduces the published scoring algorithm for personal use.
Educational tool, not medical advice. Check this tool’s method and limitations before interpreting a result. Talk to a qualified healthcare professional before making decisions about medication, diet, exercise, or treatment. See our Terms of Use.
Your rating helps improve PSQI Calculator. We store only an anonymized vote (no personal data).
How to Use PSQI Calculator
Step 1: Enter your usual schedule
Fill in usual bedtime, usual wake-up time, minutes to fall asleep, and hours of actual sleep, answering for the past month. Bedtime means when you got into bed, not when you fell asleep — habitual sleep efficiency is calculated from the clock gap between bedtime and wake time, and appears live below the four fields.
Step 2: Rate the ten disturbance items
Under question 5, rate each of items 5a to 5j on the four-point frequency scale: never, less than once a week, once or twice a week, or three or more times a week. Item 5a is highlighted because it scores into the sleep latency component, not the disturbance component.
Step 3: Answer questions 6 to 9
Rate your overall sleep quality, how often you took sleep medication, how often you struggled to stay awake during the day, and how much of a problem it was to keep up enthusiasm. These four answers feed components 1, 6 and 7.
Step 4: Read the seven component scores
The results panel shows each component scored 0 to 3 with the raw value it came from, so you can see whether your points cluster in latency, duration, efficiency, disturbances, medication or daytime function.
Step 5: Compare your global score to the cut-off
The seven components sum to a global score of 0 to 21. Above 5 classifies you as a poor sleeper; exactly 5 does not. Use the band table to see where your total sits.
Step 6: Copy or print the summary
Use the copy or print buttons to save the component breakdown. Re-run the questionnaire in four weeks and compare components side by side rather than comparing global totals.
Key Features
- Scores all 19 self-rated items into the 7 official PSQI components
- Habitual sleep efficiency computed live from bedtime, wake time and hours slept
- Item 5a scored into Component 2, where the published algorithm puts it
- Global 0-21 score against the validated poor sleeper cut-off above 5
- Component profile showing which of the 7 domains carries your points
- Copy or print a component-by-component summary for a clinician
Understanding Results
Formula
The Pittsburgh Sleep Quality Index scores 19 self-rated items into seven components, each capped at 0 to 3, and sums those seven into a global score from 0 to 21. Four components are direct lookups: Component 1 takes question 6 (subjective quality), Component 3 bands question 4 (over 7 hours = 0, over 6 to 7 = 1, 5 to 6 = 2, under 5 = 3), and Component 6 takes question 7 (medication frequency) unchanged.
The remaining three need an intermediate step. Component 2 bands your minutes to fall asleep (15 or less = 0, 16 to 30 = 1, 31 to 60 = 2, over 60 = 3), adds item 5a, then re-bands the 0 to 6 result as 0, 1–2, 3–4, 5–6. Component 4 divides actual sleep by time in bed, where time in bed is the clock gap between questions 1 and 3, and scores 85% or more = 0, 75–84% = 1, 65–74% = 2, under 65% = 3. Component 5 sums items 5b through 5j only (0 to 27) and bands it 0, 1–9, 10–18, 19–27. Component 7 adds questions 8 and 9 and re-bands the 0 to 6 result the same way as Component 2.
Reference Ranges & Interpretation
A global score greater than 5 identifies a poor sleeper. In the 1989 validation by Buysse and colleagues, that threshold separated healthy controls from patients with sleep disorders and depression at a sensitivity of 89.6% and a specificity of 86.5%, with a kappa of 0.75. Internal consistency across the seven components was a Cronbach's alpha of 0.83, measured over a 28-day retest interval. Note the operator: a score of exactly 5 is a good sleeper, and 6 is the first poor-sleeper value.
Above the cut-off, most trial reporting treats 6 to 10 as mild disturbance, 11 to 15 as the range typical of untreated chronic insomnia, and 16 to 21 as severe disturbance across several domains at once. Those bands are descriptive convention rather than part of the published instrument. The component profile carries more clinical information than the band: a global 9 concentrated in components 2 and 4 points toward sleep-onset insomnia, while the same 9 spread across components 5, 6 and 7 points toward fragmentation and daytime consequences.
Assumptions & Limitations
Every value is recalled and averaged across roughly 30 nights, so the PSQI measures perceived sleep rather than measured sleep. In the CARDIA cohort, self-reported duration exceeded wrist actigraphy by about 0.8 hours with a correlation near 0.47 — an overestimate of 48 minutes is enough to shift Component 3 by a full band. The bias inverts in insomnia, where people habitually underestimate sleep and overestimate latency.
Three further limits matter. Component 6 scores medication use, not benefit, so starting a hypnotic can raise the global score while sleep improves. The >5 cut-off was derived from a mixed adult sample and over-flags older adults, whose efficiency and fragmentation drift upward with age for non-pathological reasons; validation work in oncology and chronic-pain cohorts has proposed raising the threshold to 8. And the questionnaire does not screen for obstructive sleep apnoea — the five partner-rated items about snoring and breathing pauses are printed on the form but never scored. Bring the component profile, not just the total, to a clinician, and seek assessment promptly if you fall asleep while driving.
Complete Guide: PSQI Calculator
On this page
- PSQI, ISI or Epworth? Three tests, three questions
- Inside a PSQI calculator: the seven components
- Two people scoring 9: same total, opposite problem
- Where the line at 5 came from
- Component 4 is the one everyone scores wrong
- A month of memory against a week of actigraphy
- When 5 is the wrong line
- Above 5. What actually moves the number?
- References
The PSQI calculator returns a global score between 0 and 21, and the most useful thing to understand about that number is that it is the least informative output the questionnaire produces. Nineteen self-rated items collapse into seven components, each scored 0 to 3, and only then are those seven added together. A global 9 built entirely from short sleep and low efficiency describes a person who is not spending enough time in bed. A global 9 built from bathroom trips, pain and snoring describes a completely different patient with a completely different treatment path. The sum erases that distinction. The component profile keeps it.
This guide compares the Pittsburgh Sleep Quality Index against the two instruments it gets confused with, publishes the full component scoring algorithm so you can check the arithmetic yourself, and explains why the cut-off is “greater than 5” rather than “5 or more” — a one-point distinction that reclassifies a large slice of the general population.
PSQI, ISI or Epworth? Three Tests, Three Different Questions
These three questionnaires are routinely described as “sleep tests” and used interchangeably, which is how people end up with a normal result on the wrong instrument. They measure three separate constructs. The PSQI grades quality over a month. The Insomnia Severity Index grades distress and daytime impact over two weeks. The Epworth grades propensity to fall asleep during the day. You can score 18 on the PSQI and 4 on the Epworth without contradiction: sleeping badly all month and dozing off in meetings are not the same finding.
| Instrument | Range & cut-off | Window | Use it when |
|---|---|---|---|
| PSQI | 0–21, poor sleeper above 5 | Past month | You want a profile of which aspect of sleep is broken, or a repeatable baseline before an intervention. |
| Insomnia Severity Index | 0–28, subthreshold at 8, moderate at 15 | Past two weeks | The complaint is already insomnia and you need severity, not diagnosis. |
| Epworth Sleepiness Scale | 0–24, excessive at 11 | Recent typical life | The complaint is daytime dozing, not night-time sleep. |
| STOP-BANG | 0–8, intermediate risk at 3 | Current state | Snoring, witnessed apnoeas or unrefreshing sleep despite adequate hours. |
The practical rule: use the PSQI when you do not yet know what is wrong. It is the only one of the four that separates duration from efficiency from disturbance, so it tells you where to look next. If the answer comes back “daytime dysfunction is the highest component”, the Epworth Sleepiness Scale calculator is the logical follow-up; if it comes back “disturbances, and item 5e is a 3”, you are looking at a breathing question instead.
Inside a PSQI Calculator: The Seven Components, and the Item That Moves
Most PSQI pages tell you the score runs 0 to 21 and stop there. Here is the actual algorithm published by Buysse and colleagues in 1989, which is what the calculator above runs. Four of the seven components are simple lookups; three require an intermediate sum that is then re-banded onto the 0–3 scale.
| Component | Built from | Raw value to 0–3 |
|---|---|---|
| 1. Subjective quality | Question 6 | Very good 0, fairly good 1, fairly bad 2, very bad 3 |
| 2. Sleep latency | Question 2 (minutes) + item 5a | Minutes first: ≤15 = 0, 16–30 = 1, 31–60 = 2, >60 = 3. Add 5a, then sum 0 = 0, 1–2 = 1, 3–4 = 2, 5–6 = 3 |
| 3. Sleep duration | Question 4 | >7 h = 0, >6 to 7 h = 1, 5 to 6 h = 2, <5 h = 3 |
| 4. Habitual efficiency | Questions 1, 3 and 4 | Sleep ÷ time in bed: ≥85% = 0, 75–84% = 1, 65–74% = 2, <65% = 3 |
| 5. Disturbances | Items 5b to 5j (nine items, not ten) | Sum 0–27: 0 = 0, 1–9 = 1, 10–18 = 2, 19–27 = 3 |
| 6. Sleep medication | Question 7 | Frequency answer carried straight across, 0 to 3 |
| 7. Daytime dysfunction | Questions 8 + 9 | Sum 0–6: 0 = 0, 1–2 = 1, 3–4 = 2, 5–6 = 3 |
The item that moves is 5a. It sits visually inside the block of ten disturbance questions, so hand-scorers and a surprising number of online calculators sweep it into Component 5. It belongs to Component 2, added to the banded latency minutes. Getting this wrong rarely changes the global score by more than a point, but it moves that point from the disturbance domain to the latency domain — which is exactly the information you were collecting the component profile for.
One further detail that trips people up: the published PSQI has 24 questions, not 19. The final five ask a bed partner or roommate about snoring, leg twitching, breathing pauses and episodes of confusion. None of them are scored. They exist as clinical prompts only, which is why a person with obvious witnessed apnoeas can still produce a modest global score.
Two People Scoring 9: Same Total, Opposite Problem
This is the argument for reading components rather than totals, and it is easiest to see with two real-shaped profiles that both land on 9.
| Component | Sarah, 34 | David, 58 |
|---|---|---|
| 1. Quality | 2 | 1 |
| 2. Latency | 3 | 0 |
| 3. Duration | 2 | 1 |
| 4. Efficiency | 2 | 1 |
| 5. Disturbances | 0 | 2 |
| 6. Medication | 0 | 1 |
| 7. Daytime dysfunction | 0 | 3 |
| Global | 9 | 9 |
Sarah's nine points sit almost entirely in components 2, 3 and 4 — she takes over an hour to fall asleep, gets 5.5 hours, and runs around 70% efficiency. That is textbook sleep-onset insomnia, and the intervention with the best evidence is stimulus control and sleep restriction, not a sleeping tablet. David falls asleep in ten minutes and functions badly anyway: his points cluster in disturbances, medication and daytime dysfunction, with a 3 on daytime function despite adequate latency. Fragmentation, not sleep onset, is his problem, and a snoring or breathing question comes first. Same number, opposite first move. If your own profile looks like David's, the STOP-BANG sleep apnoea screen is the more useful next questionnaire; if it looks like Sarah's, the sleep latency calculator breaks down onset time in more detail.
Where the Line at 5 Came From
In the original 1989 validation, Buysse and colleagues tested the instrument on healthy controls against patients with diagnosed sleep disorders and depression. A global score greater than 5 separated the groups with a sensitivity of 89.6% and a specificity of 86.5%, giving a kappa of 0.75. Internal consistency across the seven components came out at a Cronbach's alpha of 0.83, and the instrument was stable over a 28-day retest interval. Those numbers are why the PSQI has survived more or less unaltered for over three decades and accumulated tens of thousands of citations.
Note the wording precisely: greater than 5, not 5 or more. A global score of exactly 5 classifies you as a good sleeper. This sounds pedantic until you look at the distribution — scores of 4, 5 and 6 are extremely common in the general adult population, so shifting the operator by one notch reclassifies a large band of people. Plenty of published papers and most casual online scorers state the rule as “≥5 indicates poor sleep”. That is simply the wrong threshold, and it inflates poor-sleeper prevalence in whatever cohort it is applied to.
Component 4 Is the One Everyone Scores Wrong
Habitual sleep efficiency is the only component derived from three questions rather than answered directly, and the arithmetic catches people out. Time in bed comes from the clock difference between question 1 (bedtime) and question 3 (getting-up time). It does not come from the hours you slept. If you go to bed at 22:30 and get up at 06:30, your time in bed is 8.0 hours regardless of what happened in between. Report 5.5 hours of actual sleep and efficiency is 68.8%, which scores a 2.
The common error is answering question 1 with “when I fell asleep” instead of “when I got into bed”. That collapses time in bed toward actual sleep time, pushes efficiency toward 95%, and quietly deletes a point or two from the global score of exactly the people who most need it flagged — those lying awake for long stretches. The 85% threshold is not arbitrary either: it is the same efficiency target used to titrate sleep restriction therapy, where the time-in-bed window is widened by 15 minutes each week only once efficiency clears 85%. If you want to track that number on its own between PSQI administrations, the sleep efficiency calculator does just that computation.
A Month of Memory Against a Week of Actigraphy
Every number the PSQI produces is recalled, not measured, and averaged over 30 nights. That matters most for questions 2 and 4. In the CARDIA cohort, Lauderdale and colleagues compared self-reported sleep duration against wrist actigraphy in more than 600 adults and found people reported roughly 0.8 hours more sleep than the devices recorded, with a correlation of only about 0.47 between the two. Overestimating by 48 minutes is enough to move Component 3 down a full band — from a 2 to a 1, or a 1 to a 0.
The bias runs the other way in insomnia. People with sleep-onset insomnia habitually underestimate how much they sleep and overestimate how long they took to fall asleep, a phenomenon formally called paradoxical insomnia or sleep-state misperception. So the PSQI is not a measurement instrument standing in for a sleep study; it is a measurement of perceived sleep, which happens to be the thing that predicts distress and daytime function better than polysomnography does. Treat a change in the score as a change in experience. If you want the arithmetic of accumulated shortfall instead, the sleep debt calculator works from hours rather than perception.
When 5 Is the Wrong Line
The >5 cut-off was derived from a mixed sample of healthy adults and psychiatric patients, and it does not transplant cleanly into every population. Two problems recur. In older adults, sleep naturally fragments and efficiency declines with age, so components 4 and 5 drift upward for reasons that are not pathology — a large share of healthy over-65s clear the threshold on age alone. In clinical populations with a heavy symptom burden, such as oncology and chronic pain cohorts, so many respondents clear 5 that the cut-off stops discriminating at all, and validation studies in those groups have proposed raising it to 8 to recover usable specificity.
The practical consequence for an individual is straightforward: if you are 70 and score 7, the interesting question is not whether you cleared a threshold derived from a younger sample, but which components carried the points and whether they have changed since the last time you measured. The PSQI is at its strongest used longitudinally against yourself, and at its weakest used as a single-shot pass or fail.
Above 5. What Actually Moves the Number?
Cognitive behavioural therapy for insomnia is the first-line treatment recommended by the American College of Physicians ahead of medication, and meta-analyses of CBT-I trials typically report global PSQI reductions in the region of 3 to 4 points. That is the realistic size of the available move, and it comes overwhelmingly from components 2 and 4 — latency and efficiency — because sleep restriction and stimulus control act directly on those two. Nothing in the protocol targets component 5, which is why a profile dominated by pain or nocturia will not respond the same way.
Sleeping medication is the trap in the scoring. Component 6 scores medication use, not benefit. Start taking a hypnotic three or more nights a week and component 6 goes from 0 to 3, so a drug that genuinely improves your latency and efficiency by two points can leave the global score flat or worse. This is a known artefact of the instrument rather than a sign the treatment failed, and it is another argument for reading the component profile rather than tracking the single number across a medication change.
The most useful next step for anyone above 5 is to re-run the questionnaire in four weeks under the same conditions and compare the seven components side by side, not the totals. A drop of one point in component 2 and one in component 4 is a real, interpretable signal that something worked. A drop of two in the global score, with no idea where it came from, is not. For a broader nightly picture that folds in timing and consistency alongside quality, the sleep score calculator covers ground the PSQI deliberately leaves out.
References
- Buysse DJ, Reynolds CF 3rd, Monk TH, Berman SR, Kupfer DJ. The Pittsburgh Sleep Quality Index: a new instrument for psychiatric practice and research. Psychiatry Research. 1989;28(2):193–213. PubMed
- Lauderdale DS, Knutson KL, Yan LL, Liu K, Rathouz PJ. Self-reported and measured sleep duration: how similar are they? Epidemiology. 2008;19(6):838–845. PubMed
- Qaseem A, Kansagara D, Forciea MA, Cooke M, Denberg TD. Management of Chronic Insomnia Disorder in Adults: A Clinical Practice Guideline From the American College of Physicians. Annals of Internal Medicine. 2016;165(2):125–133. PubMed
- National Heart, Lung, and Blood Institute. Sleep Deprivation and Deficiency. NHLBI

Written by Jurica Šinko
Founder & CEO
Entrepreneur and health information advocate, passionate about making health calculations accessible to everyone through intuitive digital tools.
View full profileFrequently Asked Questions
Is a PSQI score of 5 good or bad?
A global score of exactly 5 classifies you as a good sleeper. The published rule is greater than 5, not 5 or more, so 5 sits on the good side of the line and 6 is the first poor-sleeper score. Many papers and online scorers state the threshold as 5 or above, which wrongly reclassifies everyone scoring exactly 5 and inflates poor-sleeper prevalence in whatever group it is applied to.
What is a bad PSQI score?
Anything above 5 out of 21 puts you in the poor sleeper category. In practice, 6 to 10 reflects mild disturbance, 11 to 15 is typical of untreated chronic insomnia, and 16 to 21 means several components are scoring 2 or 3 at once. Only the split at 5 comes from the original validation; the severity bands above it are a reporting convention, not part of the instrument.
How is PSQI sleep efficiency calculated?
Divide hours of actual sleep by hours in bed, where hours in bed is the clock difference between your bedtime and your getting-up time, not the hours you slept. Bed at 22:30 and up at 06:30 is 8.0 hours in bed; report 5.5 hours of sleep and efficiency is 68.8 percent. Component 4 then scores 0 for 85 percent or more, 1 for 75 to 84, 2 for 65 to 74, and 3 below 65.
Which PSQI component does question 5a belong to?
Item 5a, cannot get to sleep within 30 minutes, scores into Component 2 (sleep latency), not Component 5 (disturbances). It is added to the banded latency minutes to give a 0 to 6 raw value, which then collapses to 0 to 3. Component 5 sums only items 5b through 5j, giving a 0 to 27 raw range. Sweeping 5a into Component 5 is the most common hand-scoring error.
What is the difference between the PSQI and the Insomnia Severity Index?
The PSQI grades sleep quality across seven separate domains over the past month and scores 0 to 21, flagging poor sleep above 5. The ISI grades the severity and daytime impact of an insomnia complaint over two weeks and scores 0 to 28, with 8 as subthreshold and 15 as moderate. Use the PSQI when you do not yet know which aspect of sleep is broken; use the ISI when insomnia is already the established complaint.
Can the PSQI detect sleep apnea?
No. Only one of the 19 scored items, 5e on coughing or snoring loudly, touches breathing at all, and it contributes at most 3 of the 27 raw points in a single component. The five partner-rated questions about snoring, breathing pauses and leg twitching are printed on the form but are never scored. People with moderate obstructive sleep apnea routinely produce PSQI scores under 5, so use STOP-BANG for that question instead.
How much can treatment lower a PSQI score?
Meta-analyses of cognitive behavioural therapy for insomnia typically report global PSQI reductions of about 3 to 4 points, and those points come mostly from components 2 and 4 because sleep restriction and stimulus control act directly on latency and efficiency. CBT-I is recommended ahead of medication as first-line treatment for chronic insomnia by the American College of Physicians.
Why did my PSQI score get worse after starting sleeping pills?
Component 6 scores how often you take sleep medication, not whether it helps. Taking a hypnotic three or more nights a week moves that component from 0 straight to 3. A drug that genuinely improves your latency and efficiency by two points can therefore leave the global score flat or one point higher. This is a known artefact of the scoring, which is why you should compare the seven components across a medication change rather than the single total.
Related Calculators
ADHD Test: Free Adult ASRS Screening Score, 18 Items
Free ADHD test using the WHO ASRS v1.1 screener. Answer 18 questions, score Part A against the cut-off of 4, then rule out the four conditions that mimic it.

Anxiety Calculator: Test Your Anxiety Symptom Level
Use our anxiety calculator to rate seven common symptoms, see your severity band, and get practical next steps you can try today. Free and completely private.
AUDIT Alcohol Calculator — Score Alcohol Use Disorder Risk
Use the AUDIT alcohol calculator to score the 10-item screening test, grade hazardous or dependent drinking risk, and see your zone-based intervention level.
Autism Test: Free AQ-10 Adult Screening Score (0-10)
Free autism test using the AQ-10 screening questionnaire: score 10 items against the 6-point cut-off and see what a positive result really means for you.

Bedtime Calculator: Find the Best Time to Go to Bed Now
Enter your wake time and the bedtime calculator suggests bedtimes by 90-minute cycles. Add a fall-asleep buffer and choose 12/24-hour time for better mornings.

Circadian Rhythm Calculator: Align Sleep & Wake Times
Use the Circadian Rhythm Calculator to identify your chronotype and align sleep and wake times. See optimal windows, plan meals, and get blue-light tips.