Use the Epworth Sleepiness Scale Calculator
Free Epworth sleepiness scale calculator: rate 8 situations, get your ESS score out of 24 with severity bands, plus a drowsy-driving flag most tools miss.
ESS score (out of 24)
0 of 24 points (0%)
| 11 = clinical cut-off| 16 = severe
How likely are you to doze off or fall asleep in the following situations, in contrast to just feeling tired? Answer for your usual way of life in recent times. If you have not done some of these things recently, estimate how they would affect you.
0 of 8 situations rated — unrated situations count as 0 points
Your Epworth Sleepiness Scale results
Total ESS score
0
out of 24
Interpretation
Lower normal
0 – 5 points
Alerting situations
0 / 6
talking, traffic
Where your points came from
A total of 12 built almost entirely from lying down, reading and watching TV is a very different clinical picture from a 12 that includes points for dozing mid-conversation. The single ESS number hides that distinction — this breakdown does not.
| Score | Interpretation | What it suggests |
|---|---|---|
| 0 – 5 | Lower normal daytime sleepiness | No excessive sleepiness. Re-check if your sleep routine changes. |
| 6 – 10 | Higher normal daytime sleepiness | Still within normal limits. Look at sleep duration and consistency first. |
| 11 – 12 | Mild excessive daytime sleepiness | Above the clinical cut-off. Discuss sleep quantity, timing and snoring with a clinician. |
| 13 – 15 | Moderate excessive daytime sleepiness | Warrants evaluation for an underlying sleep disorder such as obstructive sleep apnoea. |
| 16 – 24 | Severe excessive daytime sleepiness | Prompt sleep-medicine referral. Sleepiness at this level affects driving safety. |
Bands as published by Murray Johns, the scale's author. Many sleep clinics compress the top three rows into a single “ESS greater than 10 = excessive daytime sleepiness” rule; both conventions agree on 11 as the cut-off.
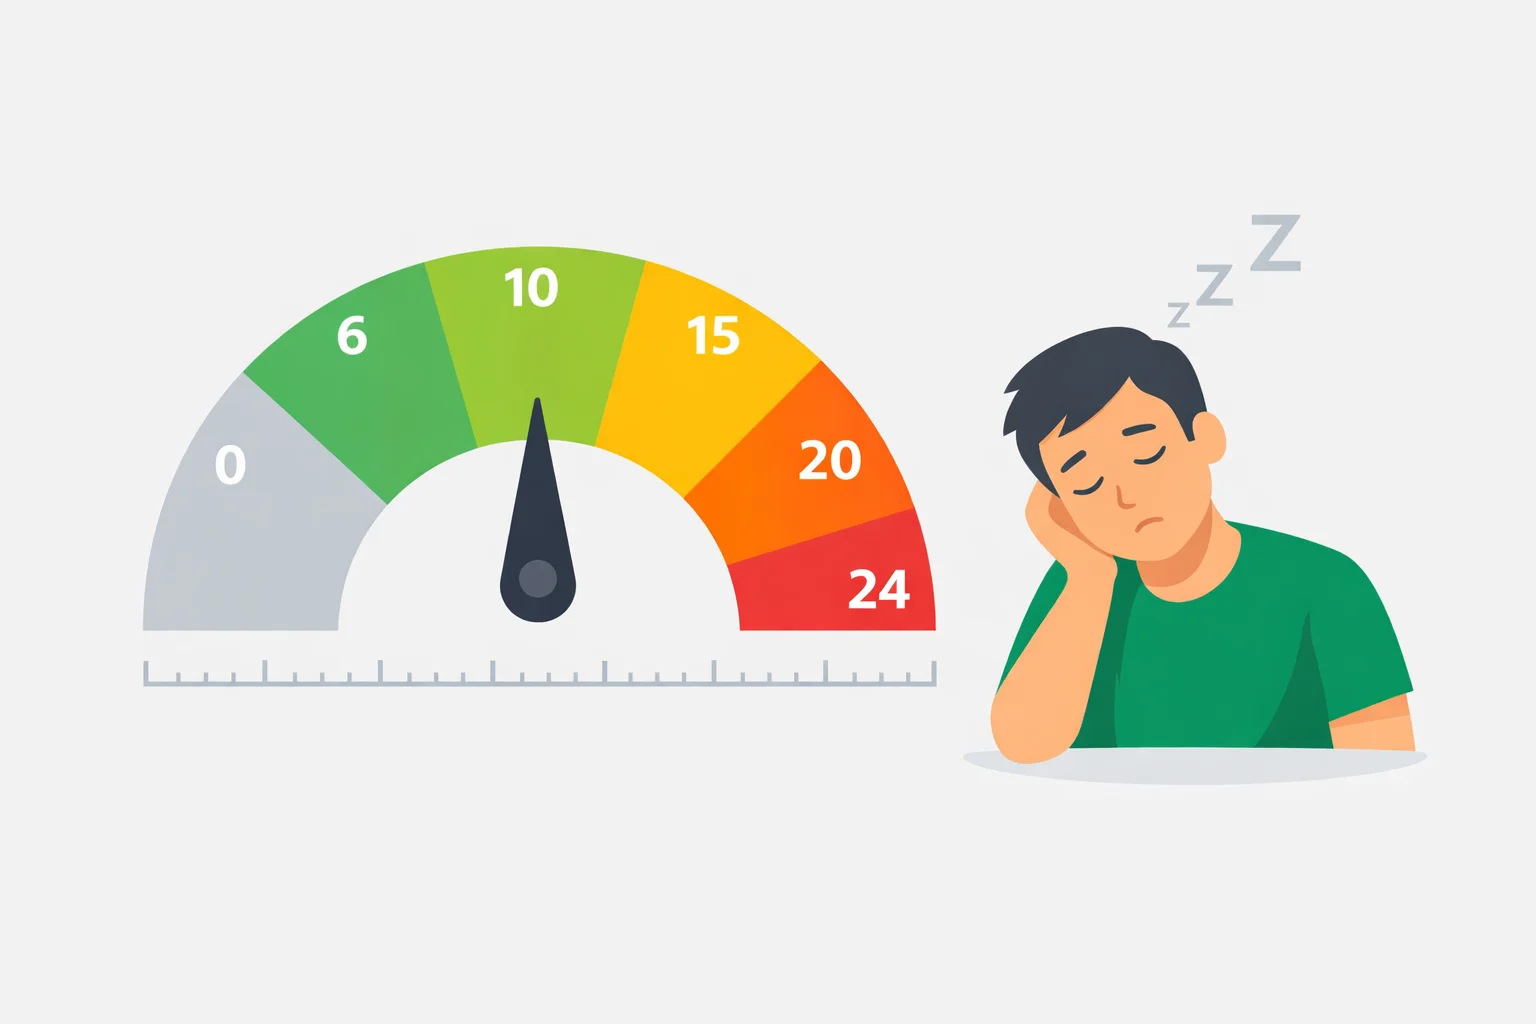
Your ESS score is 0 / 24, which falls in the lower normal daytime sleepiness range. Scores of 10 and below are considered normal sleep propensity, though a normal score does not rule out a sleep disorder. No excessive sleepiness. Re-check if your sleep routine changes.
What this score does not tell you
The ESS measures sleep propensity — how easily you fall asleep — not fatigue, and not apnoea. It correlates only weakly with the apnoea-hypopnoea index (r values around 0.2 in large clinic samples), so plenty of people with severe obstructive sleep apnoea score under 10. If you snore, wake unrefreshed, or have witnessed breathing pauses, run the STOP-BANG sleep apnoea risk screen alongside this one, and check whether short sleep is the simpler explanation with the sleep debt calculator.
This Epworth Sleepiness Scale tool is informational and does not diagnose a sleep disorder. A score above 10 means a conversation with a clinician is warranted, not that you have sleep apnoea or narcolepsy. Nothing you enter leaves your browser. If you are falling asleep while driving, stop driving and seek medical review promptly.
Educational tool, not medical advice. Check this tool’s method and limitations before interpreting a result. Talk to a qualified healthcare professional before making decisions about medication, diet, exercise, or treatment. See our Terms of Use.
Your rating helps improve Epworth Sleepiness Scale Calculator. We store only an anonymized vote (no personal data).
How to Use Epworth Sleepiness Scale Calculator
Step 1: Rate all eight situations
For each of the 8 situations, pick Never, Slight chance, Moderate chance or High chance of dozing off. Each option is worth 0, 1, 2 or 3 points. Answer for your usual life in recent times, not for one bad night.
Step 2: Read your total and severity band
The sticky bar shows your running ESS score out of 24 and its band. The two tick marks on the bar sit at 11, the clinical cut-off for excessive daytime sleepiness, and at 16, where sleepiness is classed as severe.
Step 3: Check the soporific vs alerting split
The "Where your points came from" panel separates the six low-stimulation situations (max 18) from the two high-alerting ones, sitting talking and stopped in traffic (max 6). Points in the alerting pair carry more clinical weight.
Step 4: Watch the two car items
If you score 2 or more on item 8 (stopped in traffic), or 2 on item 4 plus any points on item 8, a drowsy-driving alert appears. Treat that as a standalone finding regardless of your total score.
Step 5: Copy the summary for your clinician
Use Copy summary or Print to save all 8 individual answers alongside the total. A clinician reads the answer pattern very differently from the number on its own.
Key Features
- All 8 official Epworth situations scored 0 to 3
- Five-band interpretation from the scale author (0-5 through 16-24)
- Soporific vs alerting situation subscores the total hides
- Drowsy-driving alert triggered by the two car items
- Clinician-ready summary you can copy or print
Understanding Results
Epworth Sleepiness Scale Calculator Formula: Eight Items, 0 to 24
The Epworth Sleepiness Scale is an unweighted sum: ESS = S1 + S2 + S3 + S4 + S5 + S6 + S7 + S8, where each S is your rated chance of dozing off in that situation on a 0 to 3 scale (0 = would never doze, 1 = slight chance, 2 = moderate chance, 3 = high chance). Eight items with a 3-point maximum give a range of 0 to 24. Nothing is adjusted for age, sex, body weight or the time of day you fill it in, which is unusual among clinical instruments and is the main reason the scale takes about two minutes to complete. Every question carries identical statistical weight, so dozing off mid-conversation adds exactly as many points as dozing while lying down to rest — a simplification worth remembering when you read your own total.
Reference Ranges & Interpretation
Murray Johns, who published the scale in Sleep in 1991, defined five interpretive bands: 0–5 lower normal daytime sleepiness, 6–10 higher normal, 11–12 mild excessive daytime sleepiness, 13–15 moderate, and 16–24 severe. Many sleep clinics use a compressed version of the same rule — any score above 10 indicates excessive daytime sleepiness — and the two conventions agree exactly on 11 as the threshold. The five-band form simply tells you how far past the line you sit, which changes referral urgency: an ESS of 16 in a commercial driver is a different conversation from an ESS of 11 in a student during exam season.
Reliability is good for an eight-item questionnaire. Johns reported a test–retest correlation of 0.82 over roughly five months, and internal consistency across later validation studies falls between about 0.73 and 0.88 on Cronbach's alpha. Treat a 2-point difference between two administrations as noise; a change of 4 or more points is the size of shift that effective treatment for obstructive sleep apnoea typically produces, and is worth explaining.
Assumptions & Limitations
The scale assumes you can accurately recall and predict your own dozing behaviour across eight situations, that you have recently had the opportunity to be in them, and that you are answering about sleep propensity rather than fatigue. All three assumptions fail routinely. Item 5 asks about lying down in the afternoon “when circumstances permit”, so a retired reader who naps daily and a shift nurse who never can may share identical sleep pressure and score two points apart. People whose driving licence depends on the answer systematically under-report, a well-documented effect in commercial-driver assessment. And a score built by rating how drained you feel rather than how likely you are to fall asleep can be inflated by 4 to 6 points that do not belong there.
Most importantly, the ESS is a screening questionnaire and not a diagnostic test. It correlates only weakly with the apnoea–hypopnoea index (around 0.2 in large clinic samples), so a normal score does not rule out obstructive sleep apnoea, and it agrees only modestly with the Multiple Sleep Latency Test, where a mean sleep latency under 8 minutes defines objectively pathological sleepiness. A high score tells you that sleepiness is worth investigating; it cannot tell you whether the cause is insufficient sleep, apnoea, narcolepsy, a circadian disorder or a sedating medication. Discuss any score of 11 or higher, and any points scored on the two car items, with a qualified clinician. See the original 1991 validation paper and the NHTSA drowsy-driving guidance for source detail.
Complete Guide: Epworth Sleepiness Scale Calculator
On this page
The Epworth Sleepiness Scale calculator runs one of the simplest sums in sleep medicine: eight everyday situations, each scored 0 to 3, added into a single number between 0 and 24. There is no weighting, no age adjustment, no sex correction. Eleven is the line — score 11 or more and you have crossed into what sleep physicians call excessive daytime sleepiness. That arithmetic is so straightforward that the scale has survived largely unchanged since Dr Murray Johns published it in 1991 at the Epworth Hospital in Melbourne, and it is precisely why the ESS gets misread more often than almost any other screening instrument. A number that easy to produce feels like it means more than it does.
This guide takes apart the four beliefs that cause the most trouble: that the ESS measures tiredness, that a normal score clears you of sleep apnoea, that two identical totals mean two identical problems, and that a high score is a diagnosis. Along the way you get the exact scoring bands from the scale's author, a framework for picking the right questionnaire, and the specific numbers that push a score up or down.
Eight Situations, 0 to 3, Maximum 24
Each item asks how likely you are to doze off or fall asleep in a specific situation during your usual recent life — not how tired you feel in it. You answer 0 for “would never doze”, 1 for a slight chance, 2 for a moderate chance and 3 for a high chance. Eight items at 3 points each caps the scale at 24.
| # | Situation | Stimulation level |
|---|---|---|
| 1 | Sitting and reading | Low |
| 2 | Watching TV | Low |
| 3 | Sitting inactive in a public place | Low |
| 4 | Passenger in a car for an hour without a break | Low |
| 5 | Lying down to rest in the afternoon | Lowest |
| 6 | Sitting and talking to someone | High |
| 7 | Sitting quietly after a lunch without alcohol | Low |
| 8 | In a car, stopped for a few minutes in traffic | High |
Johns published five interpretive bands, and they are narrower than most websites reproduce: 0–5 lower normal, 6–10 higher normal, 11–12 mild excessive sleepiness, 13–15 moderate, and 16–24 severe. Many clinics collapse the top three into a single rule — ESS above 10 means excessive daytime sleepiness — which is why you will see both conventions quoted as though they conflict. They do not. Both put the cut-off at 11. The five-band version simply tells you how far past it you are, and a 16 versus an 11 changes the urgency of the referral even though both are “positive”.
The psychometrics hold up well for an eight-item questionnaire. Johns reported a test–retest correlation of 0.82 in medical students retested about five months apart, and internal consistency across later studies lands between roughly 0.73 and 0.88 on Cronbach's alpha. That is respectable reliability. Reliability, though, only means the scale measures the same thing consistently. It says nothing about whether that thing is what you think it is — which brings us to the first myth.
Sleepy Is Not the Same as Tired, and the ESS Only Measures One
This is the mistake that invalidates the most scores. Every item on the questionnaire asks about the probability of falling asleep. None of them ask about exhaustion, low energy, heavy limbs, or brain fog. In sleep medicine these are separate constructs with separate causes: sleep propensity is the pressure to lose consciousness, while fatigue is a subjective lack of energy that often comes with normal or even reduced ability to fall asleep.
The practical consequence is a large population of people who feel dreadful and score 4. Someone with hypothyroidism, iron-deficiency anaemia, long COVID, fibromyalgia or major depression may be barely functioning and still answer “would never doze” to all eight items, because their problem is energy, not sleep pressure. Insomnia produces the same paradox in a purer form: chronic insomnia is a state of hyperarousal, so a person sleeping five broken hours a night frequently scores in the lower normal band precisely because they cannotnod off in a quiet room. If you filled in this questionnaire thinking about how tired you feel rather than how easily you fall asleep, reset it and answer it again.
One more wording detail that trips people up: the instrument asks about your usual way of life in recent times, not about yesterday. A single bad night, a long-haul flight or a new baby's first fortnight should not be scored as your baseline. If your sleep has been disrupted for weeks rather than years, quantify the shortfall first with the sleep debt calculator — accumulated restriction is by far the most common reason a healthy adult scores 12, and it is the only cause on this page you can fix without a clinic.
Myth: A Low ESS Rules Out Sleep Apnoea
It does not, and the gap is wider than most people expect. Across large clinic populations the correlation between ESS score and the apnoea–hypopnoea index — the number of breathing interruptions per hour that defines apnoea severity — sits around 0.2 or lower. A correlation that weak means the ESS explains only a few percent of the variation in apnoea severity. Plenty of patients with an AHI above 30, which is severe obstructive sleep apnoea by any standard, walk in with an ESS of 7.
Why the disconnect? Sleepiness is only one of several ways apnoea presents. Others include morning headache, nocturia, hypertension that resists medication, atrial fibrillation, and simple unrefreshing sleep with no subjective drowsiness at all. Women with apnoea are disproportionately likely to report fatigue and insomnia rather than dozing, which is one documented reason apnoea has historically been under-diagnosed in women. The ESS is blind to every one of those routes.
So treat the ESS as one lane, not the whole road. If you snore loudly, have been told you stop breathing, wake with a dry mouth or headache, or carry a large neck circumference, the appropriate companion screen is STOP-BANG, which asks about snoring, tiredness, observed apnoeas, blood pressure, BMI, age, neck size and sex. You can score all eight items on the STOP-BANG calculator. A STOP-BANG of 5 or more with an ESS of 6 is a far stronger indication for a sleep study than an ESS of 14 on its own.
Two People Scoring 12: Why the Pattern Beats the Total
Here is the argument for reading your answer sheet rather than your total, and it is the reason the calculator above splits your points in two. Consider two people who both score exactly 12 — identical results by the standard scoring, both landing in mild excessive daytime sleepiness.
| Item | Person A | Person B |
|---|---|---|
| 1. Reading | 3 | 1 |
| 2. Watching TV | 3 | 1 |
| 3. Public place | 1 | 2 |
| 4. Car passenger, 1 hour | 2 | 2 |
| 5. Lying down in the afternoon | 3 | 1 |
| 6. Talking to someone | 0 | 2 |
| 7. After lunch | 0 | 1 |
| 8. Stopped in traffic | 0 | 2 |
| Total | 12 | 12 |
| Alerting items (6 + 8) | 0 / 6 | 4 / 6 |
Person A earns all twelve points in low-stimulation situations, with the biggest contributions from lying down to rest and watching television. That is close to ordinary human physiology stretched a little thin. Person A is probably short on sleep, and the fix probably starts with an extra hour in bed.
Person B is a different animal entirely. Four of the twelve points come from dozing while holding a conversation and while stopped at a red light. Falling asleep mid-sentence is not a normal response to mild sleep restriction; it is the kind of sleep pressure that shows up in untreated moderate-to-severe apnoea and in narcolepsy, where untreated patients commonly score 16 or above. Person B has a driving safety problem today, irrespective of the eventual diagnosis.
No published scoring rule captures that difference, which is a genuine limitation of the instrument rather than a criticism of it — Johns designed a single number on purpose, and its simplicity is why it spread worldwide. But when you interpret your own result, the split matters. Any score of 2 or 3 on items 6 or 8 deserves attention even if your total lands comfortably in the normal range.
Which Sleep Questionnaire Should You Actually Use?
Most people arrive at the ESS because it is the sleep questionnaire they found first, not because it answers their question. Use this to pick deliberately.
| Your actual question | Right instrument | Positive threshold |
|---|---|---|
| “Do I fall asleep more easily than I should?” | Epworth Sleepiness Scale | 11 or more of 24 |
| “Could I have obstructive sleep apnoea?” | STOP-BANG | 3 or more of 8 (5+ = high risk) |
| “Am I simply not getting enough sleep?” | Sleep diary and sleep-debt arithmetic | Under 7 hours on most nights |
| “Why does it take me so long to fall asleep?” | Sleep-onset latency tracking | Over 30 minutes, most nights |
| “How much of my time in bed is actually sleep?” | Sleep efficiency | Under 85 per cent |
| “Which part of my sleep quality is broken?” | Pittsburgh Sleep Quality Index | Above 5 of 21 |
| “Is my sleepiness objectively abnormal?” | Multiple Sleep Latency Test (lab only) | Mean latency under 8 minutes |
The last row is the one worth understanding, because it explains why a questionnaire can never be the final word. The MSLT puts you in a dark room for five scheduled naps and measures how many minutes you take to fall asleep each time; a mean under 8 minutes is pathological sleepiness. The ESS and the MSLT agree only modestly, which is unsurprising given that one asks you to remember and the other watches you sleep. The bedtime version of that measurement is something you can track yourself with the sleep latency calculator, and if your nights look fragmented rather than short, the sleep efficiency calculator separates time in bed from time asleep. The second row from the bottom is the broadest of the set: the Pittsburgh Sleep Quality Index calculator is the only one that scores latency, duration, efficiency, disturbances, medication and daytime function as six separate components rather than folding them into one number, which makes it the right starting point when the complaint is vague rather than specific.
What Inflates and Deflates Your Score
Two ESS scores taken a month apart can differ by several points without any change in your underlying health. These are the levers, and knowing them is how you avoid over-reacting to a single result.
- Recent sleep restriction. Running on 6 hours instead of 7.5 for a fortnight reliably raises sleep propensity. This is the single most common reversible cause of a score between 11 and 14.
- Sedating medication. First-generation antihistamines, benzodiazepines, gabapentinoids, opioids, mirtazapine and quetiapine all add points. So does alcohol in the evening, even though item 7 deliberately specifies a lunch without alcohol.
- Shift work and circadian misalignment. Answering the questionnaire during a run of night shifts measures your roster, not your physiology. Wait for a stable stretch of days.
- Opportunity, not just propensity. Item 5 asks about lying down in the afternoon “when circumstances permit”. A retired reader who naps daily and a shift nurse who never can may have identical sleep pressure and score two points apart, because one has the chance to notice.
- Deliberate under-reporting. Drivers whose licence depends on the answer systematically score themselves lower, a well-documented effect in commercial-driver assessments. If you are minimising on this form, you are only fooling the form.
- Fatigue mistaken for sleepiness. The reverse error inflates scores: people who answer item by item about how drained they feel rather than how likely they are to doze can add 4 to 6 points that do not belong there.
In clinical practice, a change of 2 points is noise. A shift of 4 or more between two honest administrations is worth explaining — and a 4-point drop is roughly what effective CPAP treatment produces in apnoea patients who were sleepy to begin with, which is why clinics re-run the ESS after a few months of therapy rather than only at diagnosis.
You Scored 11 or Higher. What Happens Next?
A positive ESS is a prompt for a conversation, not a diagnosis — the questionnaire cannot distinguish insufficient sleep from apnoea from narcolepsy from a medication side effect. Before that conversation, two things make it far more productive.
First, keep a two-week sleep diary: bedtime, wake time, estimated time to fall asleep, awakenings, caffeine after midday, alcohol, and shift pattern. If the diary shows an average under 7 hours, extending sleep for three weeks and re-scoring is the correct first experiment, and it costs nothing. Roughly a third of adults in the United States sleep less than 7 hours a night, so the boring explanation is also the most likely one. Second, bring the answer sheet, not just the total — a clinician reads “3 on lying down, 0 on traffic” very differently from “1 on lying down, 3 on traffic”.
Some findings should not wait for a routine appointment. Dozing off while driving, at work in a safety-critical role, or mid-conversation warrants prompt review, as does a score of 16 or more, sudden loss of muscle tone with laughter or surprise (cataplexy, which points toward narcolepsy), or witnessed breathing pauses in someone with resistant high blood pressure. On the driving question specifically, the numbers justify the caution: the US National Highway Traffic Safety Administration attributes about 91,000 police-reported crashes, 50,000 injuries and nearly 800 deaths a year to drowsy driving, while AAA Foundation research using in-car video suggests the real figure is closer to 6,400 fatal crashes, because drowsiness is rarely recorded at the roadside.
Score the questionnaire honestly, note which situations earned the points, fix your sleep opportunity first, and take the answer sheet to someone who can order a sleep study if the score does not budge. An ESS of 14 that falls to 8 after three weeks of an earlier bedtime was never a sleep disorder — and an ESS of 14 that does not move is exactly the result that justifies the referral.
References
- Johns MW. A new method for measuring daytime sleepiness: the Epworth sleepiness scale. Sleep. 1991;14(6):540–545. PubMed
- Centers for Disease Control and Prevention. Drowsy Driving. CDC Sleep
- National Highway Traffic Safety Administration. Drowsy Driving. NHTSA
- Chung F, Abdullah HR, Liao P. STOP-Bang Questionnaire: A Practical Approach to Screen for Obstructive Sleep Apnea. Chest. 2016;149(3):631–638. PubMed

Written by Jurica Šinko
Founder & CEO
Entrepreneur and health information advocate, passionate about making health calculations accessible to everyone through intuitive digital tools.
View full profileFrequently Asked Questions
How do you score the Epworth Sleepiness Scale?
Rate your chance of dozing off in each of 8 everyday situations on a 0 to 3 scale: 0 for would never doze, 1 for a slight chance, 2 for moderate and 3 for high. Add the eight answers together for a total between 0 and 24. There is no weighting, no age adjustment and no correction for sex, so every item counts equally toward the final score.
What is a normal Epworth Sleepiness Scale score?
Anything from 0 to 10 is considered normal sleep propensity. Murray Johns, who created the scale, split that range into 0 to 5 for lower normal daytime sleepiness and 6 to 10 for higher normal. A score of 11 or more crosses the clinical cut-off for excessive daytime sleepiness and is worth investigating rather than explaining away.
Is an Epworth score of 12 bad?
A 12 sits in the mild excessive daytime sleepiness band, just past the cut-off of 11. It is not an emergency and it is not a diagnosis. The most common cause of a score between 11 and 14 in an otherwise healthy adult is simple sleep restriction, so extending sleep for three weeks and rescoring is a reasonable first step. If a 12 includes points for dozing while talking to someone or while stopped in traffic, raise it with a clinician sooner.
Can you have sleep apnea with a normal Epworth score?
Yes, and it happens often. Across large clinic samples the correlation between ESS score and the apnoea-hypopnoea index is only about 0.2, so the questionnaire explains just a few percent of the variation in apnoea severity. Patients with an AHI above 30, which is severe obstructive sleep apnoea, regularly score 7 or lower. Snoring, witnessed breathing pauses, morning headache or drug-resistant high blood pressure all justify apnoea screening even with an ESS of 6.
What is the difference between the Epworth Sleepiness Scale and STOP-BANG?
They answer different questions. The ESS measures how easily you fall asleep, scoring 8 situations for a 0 to 24 total with 11 as the cut-off. STOP-BANG estimates your risk of obstructive sleep apnoea from snoring, tiredness, observed apnoeas, blood pressure, BMI, age, neck circumference and sex, scoring 0 to 8 with 3 as a positive screen and 5 or more as high risk. A STOP-BANG of 5 with an ESS of 6 is a stronger reason for a sleep study than an ESS of 14 alone.
Why is my Epworth score low when I feel exhausted all the time?
Because the ESS measures sleep propensity, not fatigue, and those are separate things. Every item asks how likely you are to actually fall asleep, not how drained you feel. Conditions such as hypothyroidism, iron-deficiency anaemia, depression and chronic insomnia produce severe fatigue alongside normal or even reduced ability to doze off. Chronic insomnia is a state of hyperarousal, so people sleeping five broken hours a night often score in the lower normal band.
What Epworth score suggests narcolepsy?
Untreated narcolepsy typically produces scores of 16 or higher, in the severe excessive daytime sleepiness band. The score alone cannot make the diagnosis. Narcolepsy is confirmed with a Multiple Sleep Latency Test, where a mean sleep latency under 8 minutes across five scheduled naps indicates pathological sleepiness. Sudden loss of muscle tone triggered by laughter or surprise, known as cataplexy, is the symptom that most strongly points toward narcolepsy and warrants prompt specialist review.
Should I stop driving if my Epworth score is high?
If you score 2 or 3 on item 8, dozing while stopped in traffic, do not drive while sleepy and get medical review promptly. That single answer matters independently of your total. The US National Highway Traffic Safety Administration links drowsy driving to roughly 91,000 police-reported crashes and nearly 800 deaths a year, while AAA Foundation in-car video research puts the toll closer to 6,400 fatal crashes. Many regions place a legal duty on drivers to report excessive sleepiness, and commercial drivers usually face stricter thresholds.
Related Calculators
ADHD Test: Free Adult ASRS Screening Score, 18 Items
Free ADHD test using the WHO ASRS v1.1 screener. Answer 18 questions, score Part A against the cut-off of 4, then rule out the four conditions that mimic it.

Anxiety Calculator: Test Your Anxiety Symptom Level
Use our anxiety calculator to rate seven common symptoms, see your severity band, and get practical next steps you can try today. Free and completely private.
AUDIT Alcohol Calculator — Score Alcohol Use Disorder Risk
Use the AUDIT alcohol calculator to score the 10-item screening test, grade hazardous or dependent drinking risk, and see your zone-based intervention level.
Autism Test: Free AQ-10 Adult Screening Score (0-10)
Free autism test using the AQ-10 screening questionnaire: score 10 items against the 6-point cut-off and see what a positive result really means for you.
Bedtime Calculator: Find the Best Time to Go to Bed Now
Enter your wake time and the bedtime calculator suggests bedtimes by 90-minute cycles. Add a fall-asleep buffer and choose 12/24-hour time for better mornings.
Circadian Rhythm Calculator: Align Sleep & Wake Times
Use the Circadian Rhythm Calculator to identify your chronotype and align sleep and wake times. See optimal windows, plan meals, and get blue-light tips.