Use the Perceived Stress Scale Calculator (PSS-10)
Free perceived stress scale calculator: score the PSS-10 with automatic reverse scoring, see both factor scores, and compare your total to US adult norms.
PSS-10 score
0 of 40 points (0%)
The questions below ask about your feelings and thoughts during the last month. In each case, indicate how often you felt or thought a certain way. Answer fairly quickly — the scale asks for an overall impression, not a tally.
Four items are worded positively and are reverse scored automatically. They are flagged below, and the panel underneath shows the exact conversion for each one.
Optional: compare against US normative data
The PSS has no diagnostic threshold — Cohen designed it as a comparative measure. Telling us your age band and sex lets the results panel place your score against the 1983 US probability sample (N = 2,387), which is far more informative than a band label.
Your PSS-10 results
Total score
—
out of 40
Band
—
answer all 10
Helplessness
—
6 direct items
Low self-efficacy
—
4 reverse items
The two factors inside your total
Answer all ten items to see how your points split between feeling overwhelmed and feeling unable to cope.
Reverse-scoring audit (items 4, 5, 7, 8)
| Item | Your answer | Raw | Scored (4 − raw) |
|---|---|---|---|
| Item 4 | — | — | — |
| Item 5 | — | — | — |
| Item 7 | — | — | — |
| Item 8 | — | — | — |
These four items are worded positively, so a high answer means less stress. Scoring them raw is the most common PSS-10 mistake and can shift a total by up to 16 points on a 40-point scale.
| Score | Band | What it means |
|---|---|---|
| 0 – 13 | Low | Below the lower third; broadly typical of, or better than, the US adult average of about 13 |
| 14 – 26 | Moderate | Middle third; above the population mean, and the range where most stress-management research recruits |
| 27 – 40 | High | Upper third; roughly 2 standard deviations above the 1983 norm, and worth discussing with a clinician |
These three bands are the 0–40 range cut into equal thirds. They are a presentational convention, not validated cut points — Cohen never published one, and no PSS score diagnoses anything. The percentile comparison above carries far more information than the band.
Answer all ten questions to see your total, your two factor scores, the reverse-scoring audit, and your position against US normative data.
The PSS-10 has no formally established minimal important difference. A common working rule is half a standard deviation of the reference sample — roughly 3 points. Because the recall window is a month, retest monthly rather than weekly.
The Perceived Stress Scale is a research instrument for measuring how unpredictable and overloading life has felt, not a diagnostic test. No PSS score identifies a disorder, and the scale contains no question about self-harm — a low total says nothing about safety. If you are in crisis or thinking about harming yourself, call or text 988 in the US or contact local emergency services immediately.
Educational tool, not medical advice. Check this tool’s method and limitations before interpreting a result. Talk to a qualified healthcare professional before making decisions about medication, diet, exercise, or treatment. See our Terms of Use.
Your rating helps improve Perceived Stress Scale Calculator (PSS-10). We store only an anonymized vote (no personal data).
How to Use Perceived Stress Scale Calculator (PSS-10)
Step 1: Answer for the last month, not today
Every PSS-10 item asks how often you felt a certain way during the last month. Pick the frequency that matches that whole window - Never, Almost never, Sometimes, Fairly often, or Very often - rather than how this morning went.
Step 2: Rate the six direct items
Items 1, 2, 3, 6, 9 and 10 ask about feeling upset, out of control, nervous, unable to cope, angered, and overwhelmed. These are added straight into your total at 0 to 4 points each.
Step 3: Rate the four reverse-scored items
Items 4, 5, 7 and 8 are worded positively and carry a blue Reverse scored badge. Answer them honestly - the calculator converts each one as 4 minus your raw answer and shows the conversion underneath so you can check it.
Step 4: Add your age band and sex for a percentile
The two optional dropdowns place your total against the 1983 US probability sample of 2,387 adults, returning the group mean, your difference in points, and an approximate percentile. This is far more informative than the band label.
Step 5: Read the two factor bars, not just the total
The results panel splits your score into perceived helplessness (out of 24) and low perceived self-efficacy (out of 16). Two people with the same total need different things depending on which bar is longer.
Step 6: Save a baseline and retest next month
Use Copy summary to keep a dated, item-by-item record, then enter that total in the tracking box at your next check. A change of about 3 points - half a standard deviation - is the usual threshold for treating a shift as real.
Key Features
- All ten official PSS-10 items with items 4, 5, 7 and 8 reversed automatically
- Live reverse-scoring audit showing each raw answer next to its converted points
- Percentile comparison against the 1983 US norms by age band and sex
- Separate perceived helplessness (0-24) and self-efficacy (0-16) factor scores
- Embedded PSS-4 subscore drawn from items 2, 4, 5 and 10
- Month-to-month tracking against the half-standard-deviation change convention
Understanding Results
How the Perceived Stress Scale Calculator Scores the PSS-10
Each of the ten items is answered on a five-point frequency scale — Never (0), Almost never (1), Sometimes (2), Fairly often (3), Very often (4) — giving a total between 0 and 40. Six items are added directly. Four are not: items 4, 5, 7 and 8 are worded positively and are converted as 4 − raw before summing, so answering “Very often” to “felt that you were on top of things” contributes 0 points rather than 4. Three further numbers fall out of the same answers. The six direct items form the perceived helplessness factor (0–24), the four reversed items form perceived self-efficacy (0–16), and items 2, 4, 5 and 10 alone make up the ultra-brief PSS-4 (0–16). Nothing in the formula adjusts for age or sex; that comparison happens afterwards, against the normative table.
Reference Ranges & Interpretation
The familiar bands — 0–13 low, 14–26 moderate, 27–40 high — are the 0–40 range divided into equal thirds. They are a presentational convention, not validated cut points: Cohen never published one, because there is no clinical diagnosis for the scale to detect. What he did publish is normative data from a 1983 US probability sample of 2,387 adults: a mean of 12.1 (SD 5.9) for men and 13.7 (SD 6.6) for women, and by age, 14.2 (SD 6.2) at 18–29 declining to 11.9 (SD 6.9) at 55–64 before flattening at 12.0 for those 65 and older. One standard deviation above your group mean — about 18 to 20 points for most adults — is a more defensible personal threshold than a generic 27. Internal consistency for the PSS-10 typically runs between 0.78 and 0.91, and later US surveys by Cohen and Janicki-Deverts found average scores higher than in 1983, which makes percentiles drawn from this table slightly conservative.
Assumptions & Limitations
The PSS measures appraisal, not exposure — every item asks how you felt, none asks what happened — so it cannot tell you whether a high score comes from workload, illness, grief or temperament. It is a state measure tied to a one-month recall window, which makes it poor at detecting week-to-week change and vulnerable to recency bias when the last few days were unusual. It screens for no disorder and contains no self-harm question, so a low total says nothing about safety. Its symptoms also overlap with conditions it cannot distinguish: generalized anxiety, major depression, thyroid disease and burnout all raise PSS scores, which is why an elevated result is a prompt to screen further rather than an answer in itself. Finally, the percentiles shown assume a normal distribution around each published mean, so treat them as estimates rather than exact ranks.
Complete Guide: Perceived Stress Scale Calculator (PSS-10)
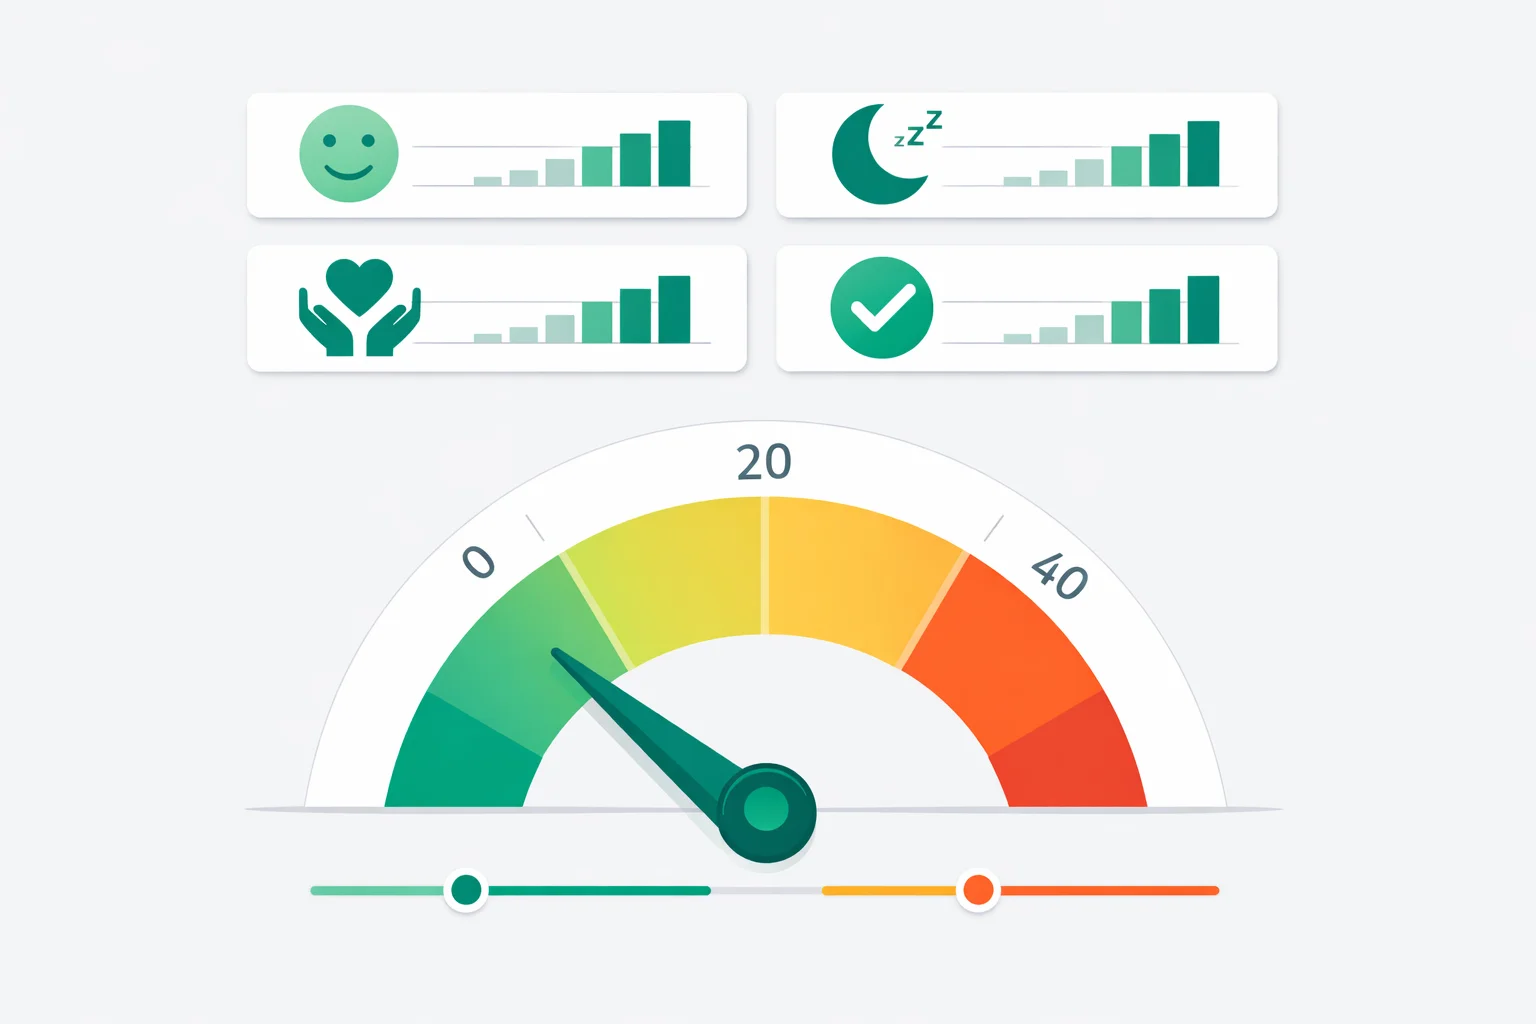
Almost every perceived stress scale calculator online will tell you that a score of 27 or higher means “high stress.” Sheldon Cohen, who wrote the scale in 1983, never published that threshold — or any threshold at all. The 0–13, 14–26 and 27–40 bands you see everywhere are simply the 0–40 range chopped into equal thirds by someone other than the author, and they have never been validated against a clinical outcome. That single fact changes how you should read your result, and it is the first of four things about the PSS-10 that get repeated wrongly across the web.
On this page
- The bands everyone quotes were never validated
- How the PSS-10 is actually scored
- Why four reversed items can move your total by 16 points
- Your score next to 2,387 other Americans
- Stress you feel vs. stress you are under
- PSS-10 vs. PSS-14 vs. PSS-4
- The two factors hiding inside one number
- What to actually do with a score of 27
The Bands Everyone Quotes Were Never Validated
Cohen was explicit that the PSS is a comparative instrument. A score of 21 means nothing on its own; it means something next to the average score of people like you. He published normative tables rather than cut points precisely because there is no diagnosis called “perceived stress” to have a threshold for. Compare that with the GAD-7, where a cut point of 10 was tested against structured clinical interviews and earned a measured 89% sensitivity. The PSS has no such number because no such study could exist.
This is not a reason to ignore your score. It is a reason to read the percentile rather than the label. A 21 is unremarkable for a 22-year-old woman — roughly the 88th percentile sounds alarming until you notice her reference mean is 14.2 with a standard deviation of 6.2, which puts 21 about one standard deviation out, the same territory as being 5 cm taller than average. The band label flattens all of that into one word.
How the PSS-10 Is Actually Scored
Ten questions, each answered on a five-point frequency scale: Never = 0, Almost never = 1, Sometimes = 2, Fairly often = 3, Very often = 4. Six items ask about feeling overwhelmed and are added directly. Four items — numbers 4, 5, 7 and 8 — are worded positively (“felt confident about your ability to handle your personal problems,” “felt that things were going your way”) and are reverse scored as 4 − raw before being added. Sum all ten and you land somewhere between 0 and 40. There is no weighting, no age adjustment inside the formula, and no sub-score arithmetic.
Worked through with real answers: suppose you answer Fairly often (3) to all six direct items, giving 18. On the four positive items you answer Almost never (1) — you rarely feel on top of things — so each scores 4 − 1 = 3, adding 12. Your total is 30. Answer those same four items Very often (4) instead, and they contribute 4 − 4 = 0 each. Same six negative answers, but the total drops from 30 to 18: from the top third of the scale to squarely mid-range. The positive items are not filler. They carry 40% of the score’s range.
Why Forgetting to Reverse Four Items Can Move Your Total by 16 Points
Reverse scoring is where hand-scored PSS results go wrong, and the failure has a peculiar shape: it is completely invisible for average responders and maximal for the people whose scores matter most. Each reversed item contributes an error of (raw) − (4 − raw) = 2 × raw − 4 when handled wrongly. At raw = 2 that error is exactly zero. It grows in both directions from there.
| Answers on items 4, 5, 7, 8 | Raw sum | Correctly reversed | Error if not reversed |
|---|---|---|---|
| All “Very often” (strong coping confidence) | 16 | 0 | +16 |
| All “Fairly often” | 12 | 4 | +8 |
| All “Sometimes” | 8 | 8 | 0 |
| All “Almost never” | 4 | 12 | −8 |
| All “Never” (no coping confidence) | 0 | 16 | −16 |
Read the bottom row carefully, because it is the dangerous one. A person who never feels on top of things, never feels confident, and never feels things are going their way should score the full 16 points on those items. Score them raw and they collect zero — understating their total by 16 points on a 40-point scale, which is enough to drag someone from the high band into the low band entirely. The mistake systematically hides the most distressed respondents. The calculator above prints the raw value and the converted value side by side for exactly this reason, and shows what your total would have been under the wrong method.
Your Score Next to 2,387 Other Americans
The reference table below comes from the 1983 US Harris Poll probability sample of 2,387 adults that accompanies Cohen’s scoring guidance. It is the closest thing the PSS has to a norm, and most calculators never show it. The last column is the score that sits one standard deviation above each group’s mean — roughly the 84th percentile, and a far more meaningful personal threshold than a generic 27.
| Group | Mean PSS-10 | SD | ~84th percentile |
|---|---|---|---|
| Men | 12.1 | 5.9 | 18 |
| Women | 13.7 | 6.6 | 20 |
| Aged 18–29 | 14.2 | 6.2 | 20 |
| Aged 30–44 | 13.0 | 6.2 | 19 |
| Aged 45–54 | 12.6 | 6.1 | 19 |
| Aged 55–64 | 11.9 | 6.9 | 19 |
| Aged 65 and older | 12.0 | 6.3 | 18 |
Two patterns are worth noticing. Perceived stress falls with age — the gap between the 18–29 group and the 55–64 group is 2.3 points, which runs against the popular assumption that midlife is peak stress. And the male-female gap of 1.6 points is real but modest: it is about a quarter of a standard deviation, so sex tells you much less about someone’s score than their age does. When Cohen and Janicki-Deverts repeated the survey in later decades, average scores came out higher than in 1983, which means a percentile calculated against this table is slightly conservative.
Stress You Feel vs. Stress You Are Under
Here is the second widespread misreading: people treat the PSS as a measure of how much stress is happening to them. It is not. Every item asks how you felt — upset, unable to control, nervous, on top of things. Nothing asks whether you moved house, lost a job, or worked 60 hours. That is a deliberate design choice rooted in Lazarus’s appraisal model: the same redundancy notice produces a shrug in one person and eight weeks of insomnia in another, and it is the appraisal, not the event, that predicts health outcomes.
The practical consequence is that a low PSS with a brutal schedule is not a contradiction, and a high PSS with a quiet month is not irrational. If you want the exposure side of the ledger — the life events, workload and lifestyle factors the PSS deliberately omits — our broader stress calculator asks about triggers rather than appraisals, and reading the two together is more useful than either alone.
There is one exposure the PSS cannot see at all: your job. The scale has no work-specific item, so a total of 30 driven entirely by a 60-hour caseload reads identically to a 30 driven by a divorce. When the pressure is clearly occupational, the instrument that separates the two is the Maslach burnout calculator, which scores exhaustion, cynicism and professional efficacy as three independent dimensions rather than one appraisal total — and those three point at three different fixes.
PSS-10 vs. PSS-14 vs. PSS-4: Which One Are You Taking?
Three versions circulate, and people compare scores across them without noticing the ranges differ. A 24 on the PSS-14 and a 24 on the PSS-10 are not the same result.
| Version | Items | Range | Reverse scored | Use it when |
|---|---|---|---|---|
| PSS-14 (1983 original) | 14 | 0–56 | 7 items | Replicating older studies; four items were dropped for weak loadings |
| PSS-10 (standard) | 10 | 0–40 | 4 (items 4, 5, 7, 8) | Default choice; cleanest factor structure, alpha typically 0.78–0.91 |
| PSS-4 | 4 (items 2, 4, 5, 10) | 0–16 | 2 items | Telephone surveys and long questionnaires where 30 seconds is the budget |
The PSS-10 is the version to use unless you have a specific reason otherwise. When the original 14 items were factor analysed, four of them loaded poorly and their removal improved internal consistency — a rare case where a shorter questionnaire measures better rather than merely faster. The PSS-4 is a genuine trade-off: it buys speed at the cost of reliability, which is why the calculator above reports it as a secondary number rather than a headline.
The Two Factors Hiding Inside One Number
Factor analyses of the PSS-10 across dozens of populations keep recovering the same two-factor structure, and the split falls exactly along the reverse-scoring line. Items 1, 2, 3, 6, 9 and 10 form perceived helplessness — things happen unexpectedly, you cannot control them, difficulties pile up. Items 4, 5, 7 and 8 form perceived self-efficacy — you handle problems, you control irritations, you feel on top of things. The four reversed items are not a psychometric trick to catch inattentive respondents. They are a second construct.
That matters because two people with a total of 24 can need opposite things. Someone scoring 20 of 24 on helplessness and 4 of 16 on self-efficacy is being crushed by volume while still trusting their own competence — the lever is demand: delegation, boundaries, headcount. Someone scoring 10 and 14 has a manageable load and a collapsed sense of capability, which is a confidence problem that responds to cognitive approaches, not a lighter calendar. The calculator plots both factors as separate bars for this reason. If the self-efficacy side dominates and low mood is in the picture, screening directly with the PHQ-9 depression questionnaire is a sensible next step, since hopelessness and low self-efficacy overlap heavily.
What to Actually Do With a Score of 27
Start by ignoring the word “high” and finding your percentile. For a 34-year-old man, 27 sits about 2.5 standard deviations above his reference mean of 12.1 — genuinely unusual, roughly the top 1%. For a 20-year-old woman it is closer to two standard deviations. In both cases the number is worth acting on, but the first case is the more striking outlier and deserves a faster conversation.
Then retest in a month, not a week. The PSS asks about the last month by design, so weekly retesting mostly measures overlapping memory of the same period. There is no formally established minimal important difference for the PSS-10; the working convention is half a standard deviation of the reference sample, about 3 points. A move from 27 to 25 is noise. A move from 27 to 21 is signal.
Finally, treat a persistently high score as a prompt to check what is underneath it rather than an endpoint. Elevated perceived stress travels with anxiety and low mood often enough that clinicians rarely stop at one instrument — the GAD-7 anxiety screening questionnaire takes two minutes and has actual validated cut points, and the four-item PHQ-4 combined screener covers anxiety and depression together. And when the stress is anchored to a single terrible event rather than accumulating load, the PCL-5 PTSD checklist calculator screens for post-traumatic stress across all four DSM-5 symptom clusters. The PSS tells you the water is rising. Those tools help identify where it is coming in.
References
- Cohen S, Kamarck T, Mermelstein R. A global measure of perceived stress. Journal of Health and Social Behavior. 1983;24(4):385–396.
- Cohen S, Janicki-Deverts D. Who’s stressed? Distributions of psychological stress in the United States in probability samples from 1983, 2006 and 2009. Journal of Applied Social Psychology. 2012;42(6):1320–1334.
- Laboratory for the Study of Stress, Immunity and Disease, Carnegie Mellon University. Perceived Stress Scale and scoring guidance.
- National Institute of Mental Health. I’m So Stressed Out! Fact Sheet.

Written by Jurica Šinko
Founder & CEO
Entrepreneur and health information advocate, passionate about making health calculations accessible to everyone through intuitive digital tools.
View full profileFrequently Asked Questions
What is a good score on the perceived stress scale?
Around 13 out of 40 is the US adult average, so anything at or below that is unremarkable. The reference means split by group: 12.1 for men, 13.7 for women, and 14.2 for adults aged 18 to 29 falling to 11.9 for those aged 55 to 64. Rather than chasing a "good" number, compare your total with your own age and sex group, since one standard deviation above your group mean lands around 18 to 20 points.
Which questions are reverse scored on the PSS-10?
Items 4, 5, 7 and 8 - the four positively worded ones about feeling confident handling problems, feeling things were going your way, controlling irritations, and feeling on top of things. Each is converted as 4 minus your raw answer, so "Very often" becomes 0 points and "Never" becomes 4. The other six items are added exactly as answered.
Is a PSS-10 score of 27 high?
It is in the upper third of the 0 to 40 range, but how unusual it is depends on who you are. For a man with a reference mean of 12.1 and a standard deviation of 5.9, a 27 sits about 2.5 standard deviations out - roughly the top 1%. For a woman aged 18 to 29 it is closer to 2 standard deviations. Either way it is worth a conversation with a clinician, especially if it holds across two monthly checks.
How do you score the perceived stress scale by hand?
Score each answer 0 for Never through 4 for Very often. For items 4, 5, 7 and 8, replace your answer with 4 minus that value. Then add all ten numbers for a total between 0 and 40. Skipping the reversal step is the most common error and can shift a total by up to 16 points - enough to move someone from the high band into the low band.
What is the difference between the PSS-10 and the PSS-14?
The PSS-14 is Cohen original 1983 version with 14 items, 7 of them reverse scored, and a 0 to 56 range. The PSS-10 drops the four items that loaded poorly in factor analysis, which actually improved internal consistency - alpha typically runs 0.78 to 0.91. Scores are not interchangeable between the two, so a 24 on the PSS-14 is a very different result from a 24 on the PSS-10.
Can the perceived stress scale diagnose anxiety or depression?
No. The PSS has no validated cut point of any kind because there is no diagnosis called perceived stress - Cohen published normative tables instead of thresholds. It also contains no question about self-harm. For screening with real operating characteristics, the GAD-7 detects generalized anxiety at a cut point of 10 with about 89% sensitivity, and the PHQ-9 does the same job for depression.
How often should I retake the perceived stress scale?
Monthly. Every item asks about the last month, so retesting weekly mostly re-measures overlapping memory of the same period. There is no formally established minimal important difference for the PSS-10; the working convention is half a standard deviation of the reference sample, about 3 points. A move from 27 to 25 is noise, while 27 to 21 is a real change.
Why does the PSS ask how I felt instead of what happened to me?
Because it measures appraisal, not exposure. All ten items ask how often you felt upset, out of control or on top of things, and none asks whether you changed jobs or worked 60 hours. That follows Lazarus stress model, where the same event produces very different responses depending on how a person reads it. It also means a low PSS during a brutal month is not a contradiction - it means your coping resources kept pace with the load.
Related Calculators
ADHD Test: Free Adult ASRS Screening Score, 18 Items
Free ADHD test using the WHO ASRS v1.1 screener. Answer 18 questions, score Part A against the cut-off of 4, then rule out the four conditions that mimic it.

Anxiety Calculator: Test Your Anxiety Symptom Level
Use our anxiety calculator to rate seven common symptoms, see your severity band, and get practical next steps you can try today. Free and completely private.
AUDIT Alcohol Calculator — Score Alcohol Use Disorder Risk
Use the AUDIT alcohol calculator to score the 10-item screening test, grade hazardous or dependent drinking risk, and see your zone-based intervention level.
Autism Test: Free AQ-10 Adult Screening Score (0-10)
Free autism test using the AQ-10 screening questionnaire: score 10 items against the 6-point cut-off and see what a positive result really means for you.

Bedtime Calculator: Find the Best Time to Go to Bed Now
Enter your wake time and the bedtime calculator suggests bedtimes by 90-minute cycles. Add a fall-asleep buffer and choose 12/24-hour time for better mornings.

Circadian Rhythm Calculator: Align Sleep & Wake Times
Use the Circadian Rhythm Calculator to identify your chronotype and align sleep and wake times. See optimal windows, plan meals, and get blue-light tips.