Use the Troponin Calculator
Free troponin calculator comparing your result to the sex-specific 99th percentile cutoff, plus delta troponin to separate an acute rise from a chronic one.
Above cutoff
3.36× 99th %ile
Cut-offs are assay-specific and are not interchangeable. The analyser name is usually printed at the foot of the lab report; if it is missing, ask which troponin platform the lab runs.
Reporting unit
Sex (sets the cut-off)
Enter the value exactly as printed. A result reported as "<3" is below the limit of detection — type 3 to see the worst case it could represent.
Peak value vs the male 99th percentile
3.36 ×
74 ng/L against a cut-off of 22 ng/L
Absolute delta
+46
ng/L
Relative delta
+164%
rising
Rate of change
+46
ng/L/h
Injury pattern (4th Universal Definition of MI)
Acute myocardial injury — dynamic pattern
Elevated with a 164% change — past the ≈20% threshold used to call a pattern dynamic. Acute injury, but the cause still needs a clinical diagnosis.
Myocardial injury is not the same as myocardial infarction. Infarction additionally requires clinical evidence of ischaemia — symptoms, ECG changes, or imaging.
ESC 0/1h algorithm
hs-cTnT (Roche)
Change of 46 ng/L meets or exceeds the 5 ng/L rule-in delta.
Meets the ESC 0/1h rule-in arm. Positive predictive value for MI is roughly 70–75% — it is a trigger for cardiology review, not a finished diagnosis.
99th percentile cut-offs and ESC 0/1h thresholds by assay (ng/L)
| Assay | Men | Women | Rule-out 0h | Δ1h out | Rule-in 0h | Δ1h in |
|---|---|---|---|---|---|---|
| hs-cTnT (Roche)(selected) | 22 | 14 | <5 or <12 | <3 | ≥52 | ≥5 |
| hs-cTnI (Abbott) | 34 | 16 | <4 or <5 | <2 | ≥64 | ≥6 |
| hs-cTnI (Siemens) | 54 | 34 | <3 or <6 | <3 | ≥120 | ≥12 |
| hs-cTnI (Beckman) | 20 | 12 | <4 or <5 | <4 | ≥50 | ≥15 |
| Conventional cTnI | 40 | 40 | — | — | — | — |
Conventional cTnI is listed at its usual 0.04 ng/mL decision limit, shown here as 40 ng/L for comparison. It is a single overall cut-off, not sex-specific.
Chest pain is an emergency — call your local emergency number, do not use a web page to decide. This tool applies published cut-offs to numbers you type in; it cannot see your ECG, your symptoms or your history, and troponin rises in pulmonary embolism, myocarditis, sepsis, kidney disease and after extreme exercise as well as in heart attack. Interpretation belongs with the clinician who ordered the test.
Educational tool, not medical advice. Check this tool’s method and limitations before interpreting a result. Talk to a qualified healthcare professional before making decisions about medication, diet, exercise, or treatment. See our Terms of Use.
Your rating helps improve Troponin Calculator. We store only an anonymized vote (no personal data).
How to Use Troponin Calculator
Step 1: Pick the assay your lab used
Choose the analyser from the assay dropdown — Roche Elecsys hs-cTnT, Abbott ARCHITECT, Siemens Atellica, Beckman Access, or a conventional cTnI assay. The platform name is usually printed at the foot of the lab report. Cut-offs are not interchangeable between platforms, so this choice changes every number below it.
Step 2: Set the reporting unit and sex
Switch the unit between ng/L and ng/mL to match your report; both draws convert together so the delta stays consistent. Then choose male or female, which sets the 99th percentile cut-off — 22 ng/L for men against 14 ng/L for women on Roche hs-cTnT.
Step 3: Enter the first troponin value
Type the 0 hour result into the First troponin field. The result panel immediately shows how many times the cut-off it represents, plotted against the dashed 99th percentile line.
Step 4: Add the serial draw to unlock delta troponin
Tick the second draw box, then enter the repeat value, the hours between draws, and the hours since symptoms began. This computes delta troponin and runs the ESC 0/1h rule-out, observe and rule-in triage for your assay.
Step 5: Read the pattern, not only the number
Check the injury pattern card. A change under roughly 20 percent on an already-elevated baseline reads as chronic myocardial injury; a larger swing, or a value crossing the cut-off between draws, reads as acute injury.
Step 6: Copy the summary for your notes
Press Copy summary to put the assay, the sex-specific cut-off, both values, the absolute and relative delta and the triage arm on your clipboard to take to an appointment.
Key Features
- Sex-specific 99th percentile cut-offs for Roche, Abbott, Siemens, Beckman and conventional assays
- Delta troponin as an absolute change, a percentage change and a rate per hour
- ESC 0/1h rule-out, observe and rule-in triage using assay-matched thresholds
- Acute versus chronic myocardial injury pattern read from the serial change
- ng/L to ng/mL conversion applied to both draws together, so the delta stays consistent
- Log-scale serial plot showing both values against the 99th percentile line
Understanding Results
Formula
The calculator runs three pieces of arithmetic. The first is a ratio against the sex-specific 99th percentile upper reference limit for the assay you selected:
Multiple of cut-off = Troponin ÷ 99th percentile URL
Absolute delta = Troponin₂ − Troponin₁
Relative delta (%) = (Troponin₂ − Troponin₁) ÷ Troponin₁ × 100
A first draw of 41 ng/L in a man on Roche hs-cTnT is 41 ÷ 22 = 1.86 times the cut-off. A repeat of 96 ng/L an hour later gives an absolute delta of +55 ng/L, a relative delta of +134%, and a rate of change of 55 ng/L per hour. Unit conversion is exact and applies to both draws together: 1 ng/mL equals 1 µg/L equals 1,000 ng/L, so a conventional result of 0.04 ng/mL is 40 ng/L.
Reference Ranges & Interpretation
Cut-offs are assay-specific and cannot be converted between platforms. The 99th percentile upper reference limits used here are 22 ng/L (men) and 14 ng/L (women) for Roche Elecsys hs-cTnT; 34 and 16 ng/L for Abbott ARCHITECT hs-cTnI; 54 and 34 ng/L for Siemens Atellica hs-cTnI; and 20 and 12 ng/L for Beckman Access hs-cTnI. Conventional non-high-sensitivity cTnI uses a single decision limit near 0.04 ng/mL (40 ng/L).
Two separate readings come out of the tool. The injury pattern follows the Fourth Universal Definition of Myocardial Infarction: any value above the 99th percentile is myocardial injury, and a serial change of roughly 20% or more marks it as acute rather than chronic. A flat elevated troponin — the classic picture in chronic kidney disease, heart failure or left ventricular hypertrophy — is chronic myocardial injury, not an evolving infarct.
The ESC 0/1h triage is a separate, faster read. On Roche hs-cTnT, rule-out is a 0h value below 5 ng/L with symptoms for more than 3 hours, or below 12 ng/L with a 1h change under 3 ng/L. Rule-in is a 0h value at or above 52 ng/L, or a 1h change of 5 ng/L or more. Everything in between is the observe zone, which catches roughly a quarter of presenters and leads to a 3-hour sample plus imaging. Rule-in carries a positive predictive value near 70–75%, so it triggers cardiology review rather than confirming a diagnosis.
Assumptions & Limitations
The calculator assumes both values came from the same assay on the same platform; mixing a troponin T from one hospital with a troponin I from another produces a meaningless delta. The ESC 0/1h thresholds are validated on samples taken about an hour apart, so the tool withholds that panel when the interval falls outside roughly 0.5 to 2 hours — the 0/2h and 0/3h protocols use different numbers. Conventional assays have no 0/1h pathway at all and need a repeat at 3 to 6 hours.
Troponin timing limits it further: a level drawn within an hour of symptom onset may be normal in a genuine infarct, because high-sensitivity assays typically detect a rise only 1 to 3 hours in. And elevation is not specific to coronary disease — pulmonary embolism, myocarditis, sepsis, tachyarrhythmia, chronic kidney disease and endurance exercise all raise it. This tool applies published cut-offs to numbers you type in; it cannot see an ECG, symptoms or history. Anyone with active chest pain should call emergency services rather than consult a web page.
Complete Guide: Troponin Calculator
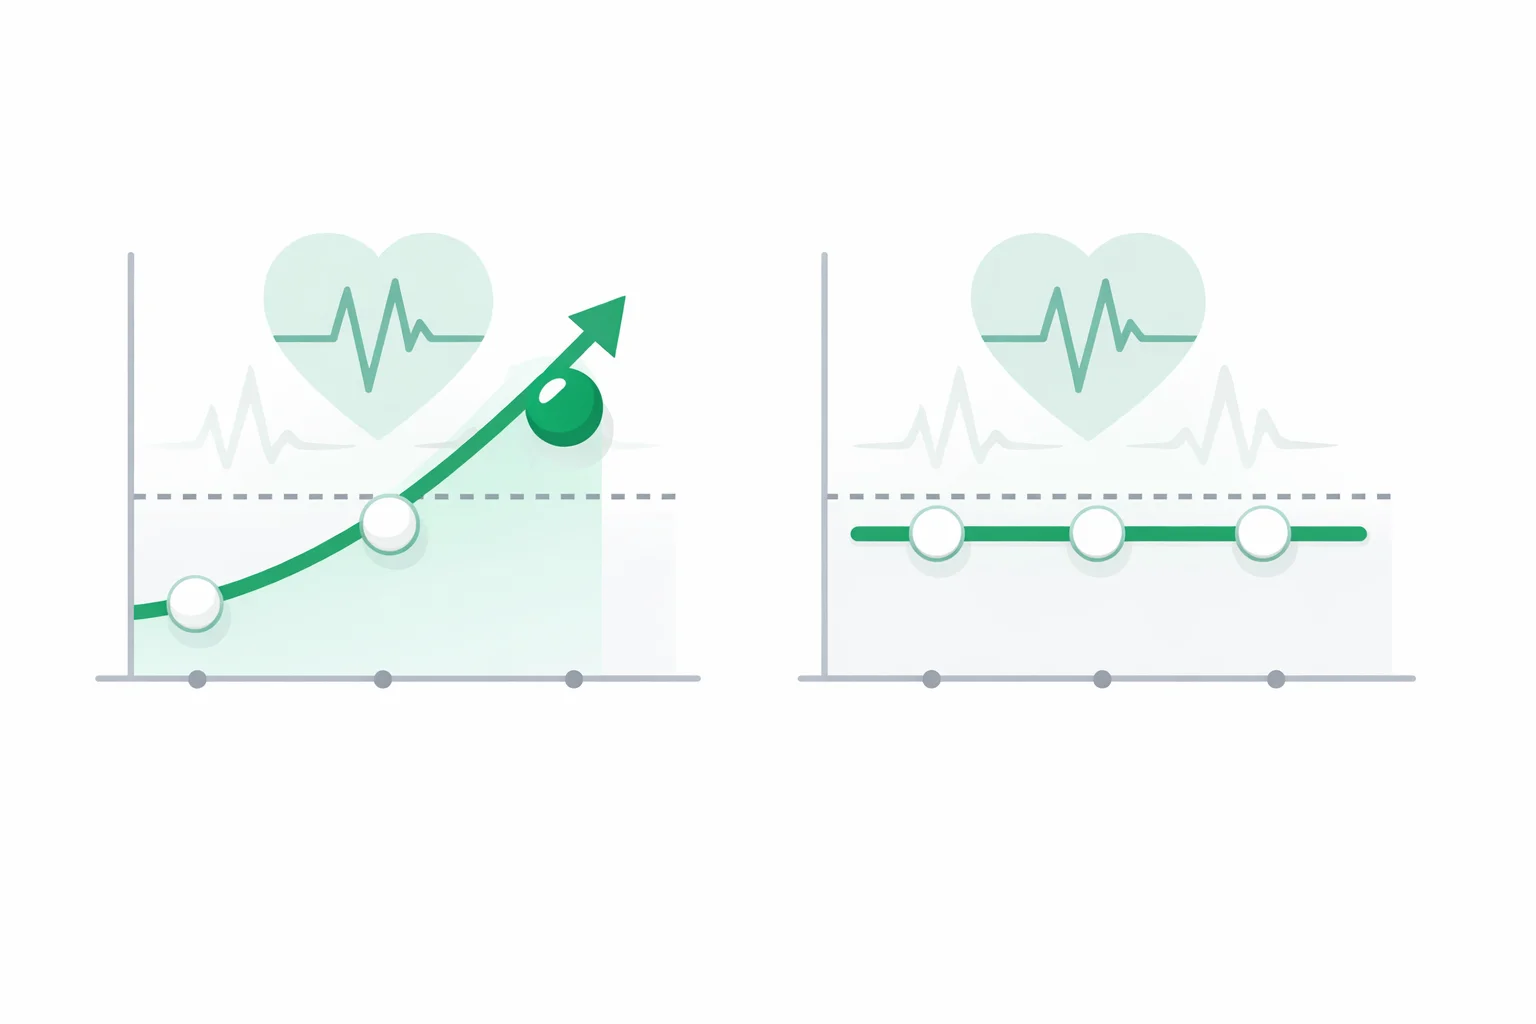
On this page
- Two patients, one troponin of 41 ng/L
- Working the delta: the arithmetic in full
- Why there is no single normal troponin level
- The 1,000-fold unit error
- Rule-out, observe, rule-in: the ESC 0/1h decision framework
- Seven reasons troponin rises that are not a heart attack
- Can a troponin calculator miss a heart attack?
- What to do with the number in front of you
- References
Any useful troponin calculator has to answer a question a single lab value simply cannot: two people can walk into the same emergency department on the same morning with an identical high-sensitivity troponin of 41 ng/L, and one of them is having a heart attack while the other is having an ordinary Tuesday. Nothing about the number 41 separates them. What separates them is the second number, drawn an hour later, and the size of the gap between the two. That gap is called delta troponin, and it is the single most under-explained figure on a cardiac lab report. This guide walks both patients through from the first blood draw to the disposition decision, then covers the assay cut-offs, the unit trap that makes results look a thousand times worse than they are, and the long list of things that lift troponin without any coronary artery being blocked.
Two patients, one troponin of 41 ng/L
Patient A is a 58-year-old man, two hours into a heavy central chest pain. His 0h high-sensitivity troponin T on a Roche Elecsys analyser comes back at 41 ng/L. Patient B is a 74-year-old woman with stage 4 chronic kidney disease, in for a dizzy spell, no chest pain at all. Her 0h hs-cTnT is also 41 ng/L. Both are above the 99th percentile — 22 ng/L for men, 14 ng/L for women on that assay — so both reports come back flagged high, and both patients get told their heart enzyme is raised.
The 1h repeat is where they diverge. Patient A returns 96 ng/L: an absolute rise of 55 ng/L, a relative rise of 134%, and a rate of change of 55 ng/L per hour. Patient B returns 43 ng/L: a rise of 2 ng/L, or 4.9%, which is within the analytical noise of the assay itself. Same starting value, same flag on the report, opposite biology. Patient A is ruled in for myocardial infarction and goes to the catheter lab. Patient B has chronic myocardial injury — a permanently raised troponin that her failing kidneys and thickened left ventricle have been producing for years, and that will read about 41 ng/L again next month.
This is why a lone troponin result, pulled up on a patient portal at 11pm, is close to uninterpretable. The calculator above is built around that fact: enter one value and it will tell you how far above or below the cut-off you are, but it will also say plainly that one value cannot tell an infarct from a chronic elevation. Enter two and it computes the delta, classifies the pattern, and runs the European Society of Cardiology 0/1h algorithm for your specific assay.
Working the delta: the arithmetic in full
Delta troponin is reported two ways, and the two disagree often enough to matter. The absolute delta is a plain subtraction:
Absolute delta = Troponin₂ − Troponin₁
Relative delta (%) = (Troponin₂ − Troponin₁) ÷ Troponin₁ × 100
Run Patient A: 96 − 41 = +55 ng/L absolute, and 55 ÷ 41 × 100 = +134% relative. Run Patient B: 43 − 41 = +2 ng/L, and 2 ÷ 41 × 100 = +4.9%. The operational threshold for calling a serial pair "dynamic" is a relative change of roughly 20%when the baseline is already elevated. Patient A clears it six times over; Patient B does not come close.
Here is the part that trips people up. The two metrics behave very differently depending on where you start. At a baseline of 4 ng/L, a rise to 9 ng/L is a spectacular +125% relative change but only +5 ng/L absolute — biologically trivial, and well inside what a low-level assay will scatter on its own. At a baseline of 800 ng/L, a rise to 900 ng/L is +100 ng/L absolute but only +12.5% relative. This is precisely why the ESC algorithm uses absolute changes in ng/L at its decision points rather than percentages: at the very low concentrations where rule-out decisions are made, percentage change is dominated by imprecision rather than by myocardium. The calculator prints both, plus the rate in ng/L per hour, so you can see when they disagree.
Why there is no single normal troponin level
People searching for a normal troponin level usually want one number. There isn't one, and the reason is worth understanding rather than working around. The upper reference limit for troponin is defined as the 99th percentile of a healthy reference population — the value that 99 out of 100 healthy people fall below. Each manufacturer establishes that percentile in their own cohort, using their own antibodies against their own epitopes on the troponin molecule. The numbers that come out are not on a common scale and cannot be converted between platforms.
| Assay | Men (ng/L) | Women (ng/L) | Ratio men : women |
|---|---|---|---|
| hs-cTnT Roche Elecsys Gen 5 | 22 | 14 | 1.6× |
| hs-cTnI Abbott ARCHITECT | 34 | 16 | 2.1× |
| hs-cTnI Siemens Atellica | 54 | 34 | 1.6× |
| hs-cTnI Beckman Access | 20 | 12 | 1.7× |
Read across that table and the practical consequence jumps out: a value of 30 ng/L is normal for a man on the Siemens platform, borderline on Roche, and clearly abnormal for a woman on Beckman. Same blood, three verdicts. Anyone comparing a result from one hospital against a reference range from another is comparing nothing at all.
The sex difference is real biology, not a rounding convention. Men carry more left ventricular mass and release more troponin at rest, which is why every manufacturer's male cut-off sits 1.6 to 2.1 times higher than the female one. Using a single overall cut-off — still common — systematically under-diagnoses infarction in women, because a woman's genuinely abnormal 20 ng/L is buried beneath a unisex threshold of 26. If you also want to see how sex changes other cardiac thresholds, the same asymmetry shows up in the QTc calculator, where the prolongation threshold differs by 10 ms between men and women.
The 1,000-fold unit error
Troponin is reported in ng/L by most modern labs and in ng/mL (identical to µg/L) by others, usually the older non-high-sensitivity assays. The conversion is exactly 1,000:
1 ng/mL = 1 µg/L = 1,000 ng/L
A result of 0.03 ng/mL is 30 ng/L. Someone who reads that 0.03 against a cut-off of 14 "concludes" they are fine when they are more than twice the limit; someone who reads 30 ng/L against a conventional cut-off of 0.04 panics over a value that is actually below it. Both errors happen, and both are purely a decimal-point problem. The classic conventional troponin I decision limit of 0.04 ng/mLis 40 ng/L — higher than every high-sensitivity 99th percentile in the table above, which is exactly why older assays miss small infarcts that modern ones catch. The unit toggle in the calculator converts both draws at once so the delta stays consistent.
Rule-out, observe, rule-in: the ESC 0/1h decision framework
The European Society of Cardiology 0/1h algorithm is the reason emergency departments can now discharge chest pain patients in about ninety minutes rather than six hours. It sorts every presenter into one of three arms using the 0h value and the 1h absolute delta, with numbers specific to each assay. On Roche hs-cTnT the arms work like this:
| Arm | Criteria (hs-cTnT, ng/L) | What follows |
|---|---|---|
| Rule-out | 0h < 5 with symptoms > 3 h, or 0h < 12 and Δ1h < 3 | Discharge pathway; NPV above 99% in validation cohorts |
| Observe | Everything in between | 3h sample, echocardiography, consider CT coronary angiography |
| Rule-in | 0h ≥ 52, or Δ1h ≥ 5 | Cardiology referral; PPV around 70–75% |
Two features of that framework deserve emphasis because they are routinely misread. First, the rule-in arm has a positive predictive value of roughly 70–75%, not 100% — about one in four rule-ins turns out to be something other than a type 1 myocardial infarction. Rule-in means "a cardiologist needs to see this now", not "this is a heart attack". Second, the single-sample rule-out at < 5 ng/L only holds if chest pain started more than three hours ago. Present within an hour of onset and the troponin may simply not have risen yet, which is why the calculator asks for hours since symptom onset and withholds the direct rule-out when that box says 2.
Roughly a quarter of presenters land in the observe zone, and that is by design rather than a failure of the algorithm. The observe arm is where the rest of the workup lives: serial ECGs, echocardiography, and formal risk scoring. Structural risk factors carry independent weight there — the kind captured by a cardiac risk calculator for 10-year Framingham risk, and by blood pressure trends tracked with a blood pressure calculator.
Seven reasons troponin rises that are not a heart attack
Troponin is a marker of cardiomyocyte injury, full stop. It says a heart muscle cell died or leaked; it says nothing about why. High-sensitivity assays are sensitive enough to detect the trace amounts released by conditions that have no coronary component at all, and this is the leading cause of alarm over results that turn out to be irrelevant to the presenting complaint.
| Cause | Typical pattern | Distinguishing feature |
|---|---|---|
| Chronic kidney disease | Flat, 2–5× cut-off | Stable across months; hs-cTnT more affected than hs-cTnI |
| Heart failure | Flat or slow drift | Rises with decompensation, settles with diuresis |
| Pulmonary embolism | Modest rise and fall | Right ventricular strain on echo; hypoxia |
| Myocarditis | Marked rise, slow fall | Young patient, recent viral illness, clean coronaries |
| Sepsis / critical illness | Rise tracking severity | Falls as the septic insult resolves |
| Tachyarrhythmia | Rise and fall over 24 h | Follows the arrhythmia, resolves on rate control |
| Endurance exercise | Peaks 3–6 h post-race, normal by 24–48 h | Asymptomatic marathon and triathlon finishers |
The marathon entry surprises people most. A substantial share of runners finishing a marathon have a post-race troponin above the 99th percentile, entirely without symptoms, and it clears within a day or two. Kidney disease is the one that causes the most day-to-day confusion, and it is worth knowing which direction the bias runs: hs-cTnT is affected considerably more than hs-cTnI as filtration falls, so the same patient can look far more alarming on a Roche platform than an Abbott one. If renal function is part of the picture, an eGFR calculator gives the context that makes a flat elevated troponin make sense.
Can a troponin calculator miss a heart attack?
Yes — and the reason is timing, not arithmetic. No troponin calculator can be more informative than the sample it is given, and troponin does not appear in blood the instant a coronary artery occludes. High-sensitivity assays typically detect a rise within 1–3 hours of injury, peaking at 12–48 hours and staying detectable for 7–14 days. Present 45 minutes into an infarct and the first troponin can be genuinely, truthfully normal.
That is the whole reason the 0/1h algorithm exists in its current shape. The 1h repeat is not there to confirm the first result; it is there to catch the rise that had not started when the first sample was taken. It also explains the three-hour rule attached to the single-sample rule-out: below the limit of detection is only reassuring once enough time has passed for a rise to have occurred. On the other end, a troponin drawn a week after an episode of chest pain may still be mildly elevated from an infarct that has already finished, which is why late presenters get judged on the falling pattern rather than the absolute height.
What to do with the number in front of you
If you have active chest pain right now, stop reading and call your local emergency number. No calculator, this one included, belongs anywhere near that decision — the ECG changes everything and no web page can see it.
If you are looking at a result from a completed visit or a routine panel, three questions get you most of the way. Which assay? Find the platform name on the report and match it in the table above, because a number without its assay is meaningless. Is there a second draw? If the record has two values, compute the delta — a change under about 20% on an already-elevated baseline points at chronic injury, not an evolving infarct. What else is going on? Kidney disease, heart failure, atrial fibrillation and a hard workout in the preceding 48 hours all move troponin, and any one of them can explain a mildly raised value in someone with no cardiac symptoms.
The single most useful thing to ask at a follow-up appointment is whether the value is new. A patient with an established baseline of 40 ng/L reading 41 has changed nothing. The same 41 in someone who read 6 last year is a different finding entirely, and worth a conversation about why it moved.
References
- Byrne RA, Rossello X, Coughlan JJ, et al. 2023 ESC Guidelines for the management of acute coronary syndromes. European Society of Cardiology — source of the 0/1h algorithm cut-offs used above.
- Thygesen K, Alpert JS, Jaffe AS, et al. Fourth Universal Definition of Myocardial Infarction (2018). Circulation — defines myocardial injury, the 99th percentile URL, and the rise-and-fall requirement.
- National Heart, Lung, and Blood Institute. Heart Attack — symptoms, diagnosis and treatment. NIH.

Written by Jurica Šinko
Founder & CEO
Entrepreneur and health information advocate, passionate about making health calculations accessible to everyone through intuitive digital tools.
View full profileFrequently Asked Questions
What is a normal troponin level?
There is no single normal troponin level, because each assay sets its own 99th percentile from its own reference population. On Roche hs-cTnT the cut-off is 22 ng/L for men and 14 ng/L for women; on Abbott hs-cTnI it is 34 and 16; on Siemens Atellica it is 54 and 34. A value of 30 ng/L is therefore normal for a man on Siemens and clearly abnormal for a woman on Abbott. Always read the number against the cut-off printed on that same report.
What troponin level indicates a heart attack?
No fixed level does. Diagnosis needs a value above the 99th percentile plus a rise or fall between serial draws plus clinical evidence of ischaemia such as chest pain, ECG changes or wall motion abnormality on imaging. The ESC rule-in thresholds give a sense of scale: 52 ng/L on Roche hs-cTnT, 64 ng/L on Abbott hs-cTnI, or a one-hour change of 5 and 6 ng/L respectively. Even a rule-in result carries a positive predictive value of only about 70 to 75 percent.
What is delta troponin and how is it calculated?
Delta troponin is the change between two samples, usually taken an hour apart. The absolute delta is simply the second value minus the first; the relative delta is that difference divided by the first value, times 100. A first draw of 41 ng/L followed by 96 ng/L gives an absolute delta of 55 ng/L and a relative delta of 134 percent. The ESC algorithm uses absolute changes because at very low concentrations a percentage change is dominated by assay imprecision rather than by heart muscle.
Is a troponin of 50 high?
On every high-sensitivity assay in common use, 50 ng/L is above the 99th percentile, so it counts as myocardial injury. Whether it matters depends entirely on the second draw. If a repeat at one hour reads 52, that 4 percent change is a flat chronic elevation typical of kidney disease or heart failure. If it reads 140, that is a 180 percent rise and an acute event. A single 50 with no comparison value cannot distinguish the two.
Can troponin be high without a heart attack?
Yes, and it is common. Troponin marks heart muscle cell injury of any cause, not coronary blockage specifically. Chronic kidney disease, heart failure, pulmonary embolism, myocarditis, sepsis, fast atrial fibrillation and endurance exercise all raise it. A large share of marathon finishers exceed the 99th percentile a few hours after the race with no symptoms at all, clearing within 24 to 48 hours. The distinguishing feature is the pattern: non-coronary causes usually give a flat or slowly drifting level rather than a sharp rise and fall.
How long after a heart attack does troponin rise?
High-sensitivity assays usually detect a rise 1 to 3 hours after the injury starts, with the peak at 12 to 48 hours and detectable levels persisting for 7 to 14 days. That delay is why a troponin drawn 45 minutes into an infarct can be genuinely normal, and why the single-sample rule-out below 5 ng/L on Roche hs-cTnT is only valid once symptoms have been present for more than 3 hours. The one-hour repeat exists specifically to catch a rise that had not begun at the first draw.
Why is the troponin cut-off different for men and women?
Men carry more left ventricular mass and release more troponin at rest, so every manufacturer sets a male 99th percentile 1.6 to 2.1 times higher than the female one. Using one unisex cut-off systematically under-diagnoses infarction in women, because a woman with a genuinely abnormal 20 ng/L on Abbott hs-cTnI disappears beneath a combined threshold of 26 ng/L. Studies applying sex-specific thresholds roughly double the proportion of women identified with myocardial injury.
What is the difference between troponin I and troponin T?
They are two different subunits of the same cardiac troponin complex, each measured by different assays with different cut-offs. Both are heart-specific. The practical difference is renal handling: hs-cTnT is affected considerably more than hs-cTnI as kidney filtration falls, so a patient with stage 4 chronic kidney disease can look markedly more alarming on a Roche troponin T platform than on an Abbott troponin I platform. Neither is universally better; what matters is comparing the result against the cut-off for the assay that produced it.
Related Calculators
A1C Calculator — Convert HbA1c to eAG with Targets
Use our A1C calculator to convert HbA1c to estimated average glucose (eAG). See normal, prediabetes, and diabetes thresholds in mg/dL and mmol/L. Fast results.

Albumin Calculator — Serum Albumin Level Interpretation
Free albumin calculator to interpret serum albumin levels, grade hypoalbuminemia, and compute A/G ratio plus albumin-corrected calcium from your lab results.
Albumin-Corrected Anion Gap Calculator — Hidden Acidosis
Use our albumin-corrected anion gap calculator to raise the anion gap by 2.5 per 1 g/dL of low albumin and reveal a hidden high-gap metabolic acidosis.

ANC Calculator: Absolute Neutrophil Count & Neutropenia
Free ANC calculator to calculate absolute neutrophil count from WBC and differential. Get ANC in cells/uL and x10^9/L with instant neutropenia grading.
Anion Gap Calculator — Metabolic Acidosis Evaluation
Free anion gap calculator finds serum anion gap from sodium, chloride, and bicarbonate, with albumin correction and delta ratio for metabolic acidosis.
AST/ALT Ratio Calculator — Free De Ritis Ratio Tool
Use our free AST/ALT ratio calculator to compute the De Ritis index instantly. Visual ratio chart, enzyme-level assessment, and clinical patterns guide.