Use the Non-HDL Cholesterol Calculator
Free non HDL cholesterol calculator: subtract HDL from total cholesterol, see your risk-based target, and spot the remnant cholesterol an LDL reading hides.
These two numbers are all non-HDL needs. Unlike LDL, the subtraction does not require fasting.
Targets tighten as risk rises. Not sure which applies? Estimate your 10-year ASCVD risk.
Optional: add triglycerides or a measured LDL
Splits non-HDL into LDL and remnant cholesterol.
Overrides the Friedewald estimate and gives a true remnant figure.
205 total − 40 HDL
The thin vertical line marks your moderate risk target of 160 mg/dL.
Distance to your non-HDL target
What makes up your 205 mg/dL of total cholesterol
Non-HDL is the amber plus red portion — every particle that can build plaque. The emerald HDL slice is the only part the subtraction removes.
Non-HDL Targets by Risk Category
| Risk category | US LDL goal | US non-HDL goal | ESC LDL goal | ESC non-HDL goal |
|---|---|---|---|---|
| Low risk | 160 | 190 | 116 | 146 * |
| Moderate risk | 130 | 160 | 100 | 130 |
| High risk | 100 | 130 | 70 | 100 |
| Very high risk | 70 | 100 | 55 | 85 |
All values in mg/dL. US goals follow the NCEP ATP III / ACC-AHA convention that a non-HDL goal sits 30 mg/dL above the matching LDL goal. * ESC/EAS 2019 states secondary non-HDL goals for moderate risk and above; the low-risk figure is derived using the same +30 rule.
Non-HDL Cholesterol Normal Range (General Population)
| Category | Non-HDL (mg/dL) | Matching LDL band |
|---|---|---|
| Optimal | Below 130 | Below 100 |
| Above optimal | 130–159 | 100–129 |
| Borderline high | 160–189 | 130–159 |
| High | 190–219 | 160–189 |
| Very high | 220 and above | 190 and above |
Every non-HDL band sits exactly 30 mg/dL above its LDL counterpart, because a person with normal triglycerides carries roughly 30 mg/dL of cholesterol inside VLDL particles.
Educational tool, not medical advice. Check this tool’s method and limitations before interpreting a result. Talk to a qualified healthcare professional before making decisions about medication, diet, exercise, or treatment. See our Terms of Use.
Your rating helps improve Non-HDL Cholesterol Calculator. We store only an anonymized vote (no personal data).
How to Use Non-HDL Cholesterol Calculator
Step 1: Enter your total cholesterol
Type the total cholesterol from your lipid panel into the Total Cholesterol field. Switch the Units toggle to mmol/L first if your lab reports on that scale.
Step 2: Enter your HDL cholesterol
Add your HDL into the HDL Cholesterol field. Non-HDL appears instantly as the difference between the two, and no fasting sample is required.
Step 3: Pick your risk category
Choose Low, Moderate, High or Very high risk in the dropdown. Your non-HDL target tightens from 190 down to 100 mg/dL as the category rises.
Step 4: Add triglycerides for the breakdown
Open the optional panel and enter triglycerides to split non-HDL into LDL and remnant cholesterol, shown as a colour-coded composition bar.
Step 5: Read your distance to target
The result panel reports how far you sit above or below both the US ACC/AHA target and the European ESC/EAS 2019 target for your tier.
Step 6: Check the discordance flag
If your LDL clears its goal while non-HDL does not, an orange callout appears and quantifies the remnant cholesterol driving that gap.
Key Features
- Subtracts HDL from total cholesterol in mg/dL or mmol/L
- Risk-tier targets from both ACC/AHA and ESC/EAS 2019 guidelines
- Flags LDL and non-HDL discordance when remnant cholesterol hides risk
- Splits non-HDL into LDL and remnant cholesterol on a composition bar
- Stays valid above 400 mg/dL triglycerides where Friedewald LDL fails
- Accepts a measured direct LDL for a true remnant cholesterol figure
Understanding Results
The Formula Behind the Non-HDL Cholesterol Calculator
Non-HDL cholesterol = total cholesterol − HDL cholesterol. Total cholesterol is the sum of the cholesterol carried in every lipoprotein in your blood; HDL is the one fraction that removes cholesterol from artery walls rather than depositing it. Subtracting HDL therefore leaves the cholesterol inside every particle that carries an apolipoprotein B molecule — LDL, VLDL, IDL, chylomicron remnants and lipoprotein(a). With total cholesterol of 205 mg/dL and HDL of 40 mg/dL, non-HDL is 165 mg/dL. Entering triglycerides splits that figure further: Friedewald LDL = non-HDL − (triglycerides ÷ 5), and whatever remains is remnant cholesterol.
Reference Ranges & Interpretation
For the general population, non-HDL below 130 mg/dL (3.4 mmol/L) is optimal, 130–159 is above optimal, 160–189 borderline high, 190–219 high, and 220 or above very high. Personal targets override those bands. Under the NCEP ATP III and ACC/AHA convention every non-HDL goal sits 30 mg/dL above the matching LDL goal: below 190 at low risk, 160 at moderate risk, 130 at high risk and 100 with established cardiovascular disease. The 2019 ESC/EAS guidelines are stricter, setting secondary non-HDL goals of 130, 100 and 85 mg/dL for moderate, high and very high risk. Remnant cholesterol above 30 mg/dL is independently associated with ischaemic heart disease in the Copenhagen population studies.
Assumptions & Limitations
Non-HDL measures cholesterol mass, not particle count, so it can still understate risk in people whose LDL particles are small and dense — apolipoprotein B measures the particles directly if your lab offers it. The LDL and remnant breakdown shown here relies on the Friedewald equation, which assumes a fixed 5:1 triglyceride-to-cholesterol ratio in VLDL and becomes unreliable above 400 mg/dL of triglycerides; the calculator withholds that split beyond the limit while the non-HDL figure itself remains valid. Lipids drawn during acute illness, in the weeks after surgery, or during pregnancy do not reflect your baseline. Risk-tier targets assume you already know your category — estimate it first if you do not. This tool is for education and does not replace a clinician's assessment of your full cardiovascular picture.
Complete Guide: Non-HDL Cholesterol Calculator
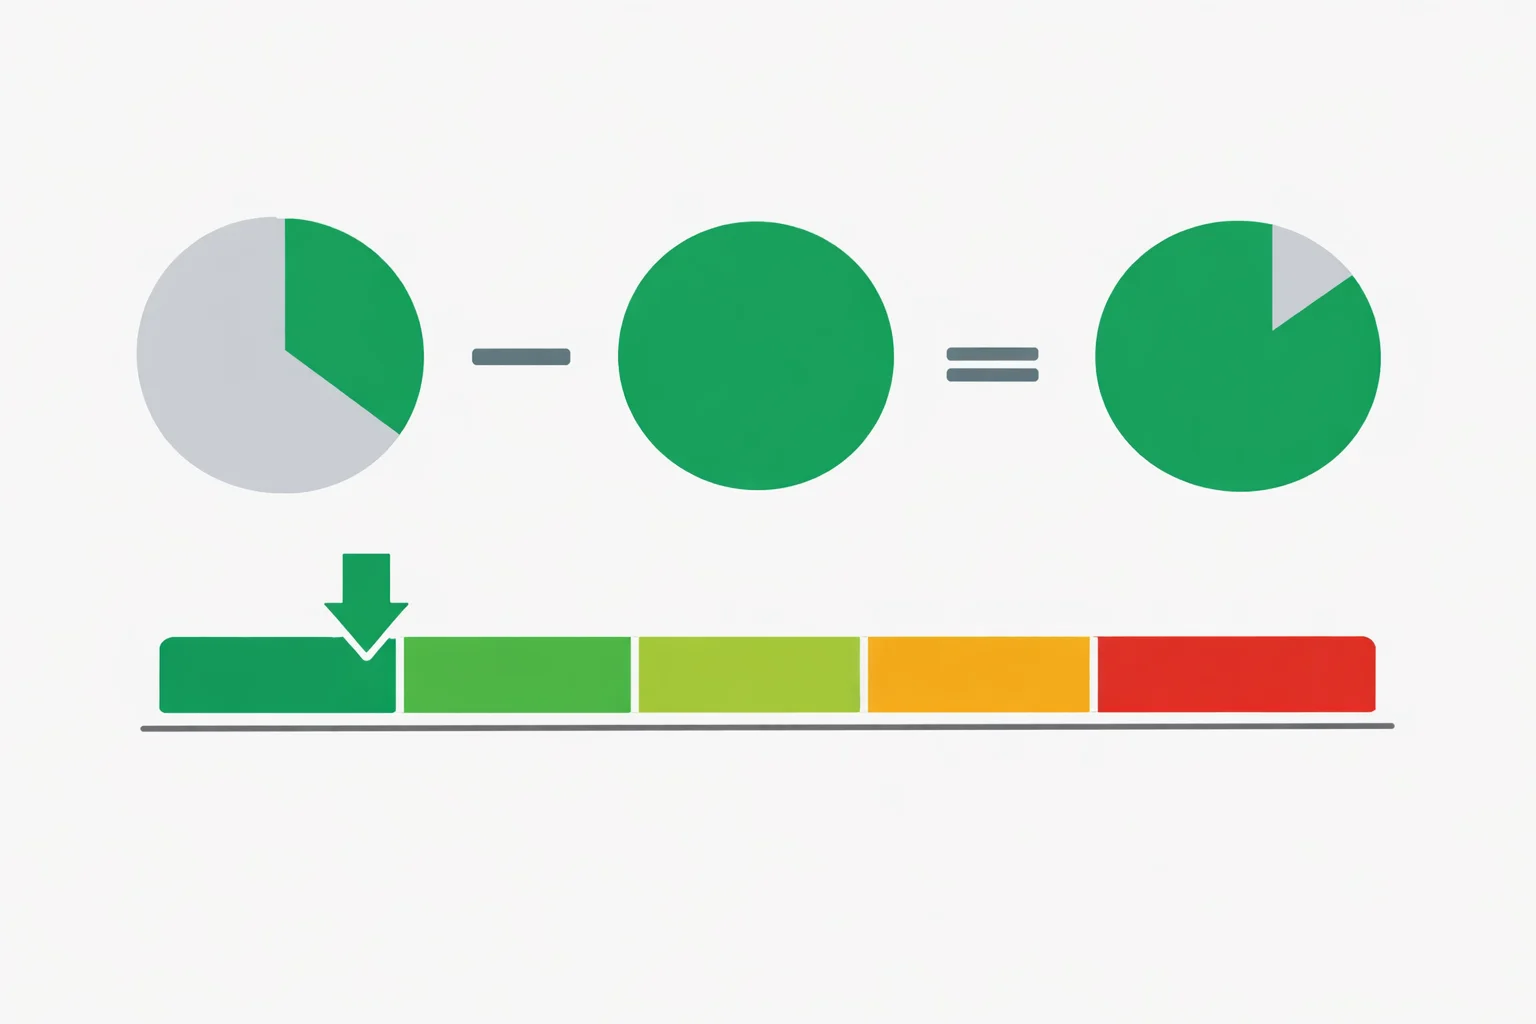
A non HDL cholesterol calculator performs one subtraction — total cholesterol minus HDL — and that single number beat LDL as a predictor of heart attacks and strokes in a meta-analysis of eight statin trials covering 62,154 patients. Boekholdt and colleagues reported a hazard ratio of 1.16 per standard deviation for non-HDL cholesterol against 1.13 for LDL. The margin is small. What is not small is how often the two numbers disagree about whether a person is at goal, and this guide is about that disagreement: when non-HDL and LDL tell different stories, which one is right, and what the gap between them is actually made of.
On this page
- Non-HDL vs LDL: why the simpler number wins
- The formula, worked through a real panel
- Why every target is your LDL goal plus 30
- When LDL lies: triglycerides above 400 mg/dL
- Discordance: an LDL of 125 under a non-HDL of 165
- Non-HDL vs ApoB: which should you track?
- What moves non-HDL, and by how much
- References
Non-HDL vs LDL: Why the Simpler Number Wins
LDL cholesterol counts the cholesterol inside one type of particle. Non-HDL cholesterol counts the cholesterol inside every particle that can lodge in an artery wall: LDL, VLDL, IDL, chylomicron remnants and lipoprotein(a). Each of those carries exactly one apolipoprotein B molecule, so non-HDL is a rough headcount of atherogenic particles rather than a measurement of one family of them.
That difference matters most in the people who are hardest to assess. Someone with triglycerides of 90 mg/dL carries about 18 mg/dL of cholesterol outside LDL, so their LDL and non-HDL move together and either number works. Someone with triglycerides of 350 mg/dL carries roughly 70 mg/dL outside LDL — and an LDL-only reading silently discards all of it.
| Measure | What it counts | Extra cost | Fasting? | Fails when |
|---|---|---|---|---|
| LDL (calculated) | Cholesterol in LDL only | None | Yes, 9–12 h | Triglycerides above 400 mg/dL |
| Non-HDL | Cholesterol in all apoB particles | None | No | Rarely — it has no upper validity limit |
| Apolipoprotein B | The particles themselves, not their cargo | A separate assay | No | Not always ordered or reimbursed |
The Formula, Worked Through a Real Panel
The arithmetic is one line:
Non-HDL cholesterol = Total cholesterol − HDL cholesterol
Take the panel loaded into the calculator above — total cholesterol 205 mg/dL, HDL 40 mg/dL, triglycerides 200 mg/dL. Non-HDL is 205 − 40 = 165 mg/dL. Adding triglycerides splits that 165 into its two parts using the Friedewald equation: LDL = 165 − (200 ÷ 5) = 125 mg/dL, leaving 40 mg/dL of remnant cholesterol riding in triglyceride-rich particles. Non-HDL is simply those two added back together, and 80% of this person's total cholesterol turns out to be atherogenic.
In mmol/L the subtraction is identical — 5.30 − 1.03 = 4.27 mmol/L — because both values share the same conversion factor of 0.02586. Triglycerides do not: they convert at 0.01129, which is why the Friedewald divisor changes from 5 in mg/dL to 2.2 in mmol/L. If your report mixes units, run the numbers through our full lipid panel calculator first.
One practical consequence of the formula being this short: non-HDL needs no fasting sample. Total cholesterol and HDL barely move after a meal, so the subtraction holds whether blood was drawn at 8 a.m. or after lunch. A calculated LDL does not survive the same test, because the triglycerides feeding it can rise 20–30% postprandially.
Why Every Target Is Your LDL Goal Plus 30
Look at any non-HDL goal and you will find the matching LDL goal exactly 30 mg/dL below it: 70 and 100 for very high risk, 100 and 130 for high risk, 130 and 160 for moderate risk, 160 and 190 for low risk. That 30 is not a safety buffer or a rounding convention. It is the cholesterol carried in VLDL by a person with normal triglycerides — 150 ÷ 5 = 30 mg/dL. The NCEP Adult Treatment Panel III set the offset by asking what non-HDL would be in someone who hit their LDL goal and had triglycerides at the upper end of normal.
The rule has a sharp edge. It only holds while triglycerides are near 150 mg/dL. At 300 mg/dL the VLDL contribution is 60 mg/dL, so hitting an LDL of 100 leaves non-HDL at 160 — 30 above the goal that was supposed to travel with it. That is the whole reason ATP III made non-HDL a formal secondary target specifically for people whose triglycerides reach 200 mg/dL or higher, and why European ESC/EAS goals are tighter still at 85, 100 and 130 mg/dL.
When LDL Lies: Triglycerides Above 400 mg/dL
Friedewald's 1972 equation assumes a fixed 5:1 ratio of triglycerides to cholesterol inside VLDL. Above roughly 400 mg/dL of triglycerides the ratio breaks down and the equation reports an LDL that is too low — sometimes by 20 mg/dL or more, occasionally producing a negative number outright. Most laboratories stop reporting a calculated LDL past that point and print a blank or a comment instead.
Non-HDL has no such ceiling. It never touched triglycerides in the first place, so a panel showing total cholesterol 260, HDL 32 and triglycerides 620 still yields a perfectly valid non-HDL of 228 mg/dL — and at that level, the person is far above every risk-tier target on the chart. This is precisely the scenario where a blank LDL field on a lab report has, more than once, been read as reassurance. It is the opposite. If your triglycerides are in this territory, our triglyceride calculator covers the separate pancreatitis threshold that becomes relevant above 500 mg/dL.
The newer Sampson/NIH equation extends calculated LDL to 800 mg/dL of triglycerides, and our LDL cholesterol calculator runs both formulas side by side so you can see how far apart they drift. Non-HDL remains the number that needs no equation at all.
Discordance: An LDL of 125 Under a Non-HDL of 165
Discordance is what happens when your two numbers land in different categories. The worked panel above is a textbook case at moderate risk: LDL of 125 clears the 130 goal, non-HDL of 165 misses the 160 goal. One reading says treated, the other says not at target. The 40 mg/dL separating them is remnant cholesterol, and the Copenhagen General Population Study has tied remnant cholesterol above 30 mg/dL to raised ischaemic heart disease risk independently of LDL.
Discordance is not rare and it is not random. It clusters in metabolic syndrome, type 2 diabetes, obesity and chronic kidney disease — the same conditions that push triglycerides up and HDL down. Roughly a fifth of adults who reach their LDL goal on a statin remain above their non-HDL goal. Those people are, on paper, treated successfully; on non-HDL they still carry meaningful residual risk. If a low HDL is driving your gap, the cholesterol ratio calculator shows the same imbalance from the other direction.
The practical move when the two disagree: treat the non-HDL number. Guidelines are explicit that it is the secondary target once LDL is controlled, and the arithmetic makes it the more conservative of the two.
Non-HDL vs ApoB: Which Should You Track?
Apolipoprotein B counts particles directly, and in head-to-head analyses it edges out non-HDL by a small margin. The Boekholdt meta-analysis put apoB at a hazard ratio of 1.14 per standard deviation against non-HDL's 1.16 — statistically indistinguishable. The honest summary is that they measure nearly the same thing, because every apoB particle carries cholesterol and non-HDL sums that cholesterol.
Where they part ways is availability. Non-HDL costs nothing extra: it comes free from a lipid panel you already have, which is why this calculator needs only two numbers off your existing report. ApoB requires a separate immunoassay that is not universally ordered or reimbursed. If your lab reports apoB, use it. If it does not, non-HDL captures the great majority of the same signal — and unlike apoB, you can calculate it yourself from a five-year-old lab printout.
What Moves Non-HDL, and by How Much
Because non-HDL bundles LDL and remnants together, it responds to two separate levers — anything that lowers LDL, and anything that lowers triglycerides. That is why it often improves faster than LDL alone in people with high triglycerides.
- Statins lower LDL 25–55% depending on agent and dose, and non-HDL falls by a similar percentage plus a further 10–20% reduction in triglycerides.
- Losing 5–10% of body weight typically cuts triglycerides by around 20%, which alone removes roughly 8 mg/dL from non-HDL at a starting triglyceride level of 200.
- Cutting added sugar and refined starch hits triglycerides harder than it hits LDL. Liver VLDL production is carbohydrate-driven, so this lever moves the remnant half of non-HDL specifically.
- Alcohol raises triglycerides in a dose-dependent way and can add 20–50 mg/dL in heavy drinkers — an underestimated contributor when LDL looks fine but non-HDL does not.
- Untreated hypothyroidism and poorly controlled diabetes raise both halves at once. Correcting either can move non-HDL more than a dose increase would.
Recheck 6–12 weeks after any change. Lipids need that long to settle, and a panel drawn during an acute illness or within a few weeks of surgery will read artificially low. Once you have a stable number, feed it into the ASCVD risk calculator to see how much of your ten-year risk it is actually driving.
References
- Boekholdt SM, et al. Association of LDL cholesterol, non-HDL cholesterol, and apolipoprotein B levels with risk of cardiovascular events among patients treated with statins: a meta-analysis. JAMA. 2012;307(12):1302–1309.
- National Cholesterol Education Program. Third Report of the Expert Panel on Detection, Evaluation, and Treatment of High Blood Cholesterol in Adults (ATP III). NHLBI, 2002 — establishes non-HDL as a secondary target at triglycerides ≥ 200 mg/dL.
- Mach F, et al. 2019 ESC/EAS Guidelines for the management of dyslipidaemias. Eur Heart J. 2020;41(1):111–188 — source of the 85, 100 and 130 mg/dL non-HDL goals.
- Varbo A, et al. Remnant cholesterol as a causal risk factor for ischemic heart disease. J Am Coll Cardiol. 2013;61(4):427–436.

Written by Jurica Šinko
Founder & CEO
Entrepreneur and health information advocate, passionate about making health calculations accessible to everyone through intuitive digital tools.
View full profileFrequently Asked Questions
What is a normal non-HDL cholesterol level?
For the general population, below 130 mg/dL (3.4 mmol/L) is optimal, 130 to 159 is above optimal, 160 to 189 is borderline high, 190 to 219 is high, and 220 or more is very high. Each band sits exactly 30 mg/dL above the matching LDL band. If you already have diagnosed heart disease or diabetes, your personal target is tighter than the population range: 100 mg/dL for high risk and 100 or below for established cardiovascular disease.
How do you calculate non-HDL cholesterol?
Subtract HDL cholesterol from total cholesterol. That is the whole formula: non-HDL = total cholesterol minus HDL. A panel showing total cholesterol 205 mg/dL and HDL 40 mg/dL gives a non-HDL of 165 mg/dL. The subtraction works identically in mmol/L because both values use the same 0.02586 conversion factor, so 5.30 minus 1.03 gives 4.27 mmol/L.
Why is the non-HDL target 30 points higher than the LDL target?
Because a person with triglycerides at the top of the normal range carries about 30 mg/dL of cholesterol inside VLDL particles, and 150 divided by 5 equals 30. The NCEP Adult Treatment Panel III set every non-HDL goal at the LDL goal plus that 30. The rule only holds near 150 mg/dL of triglycerides though: at 300 mg/dL the VLDL contribution doubles to 60 mg/dL, which is why non-HDL becomes the more informative number in exactly those patients.
Is a non-HDL cholesterol of 165 bad?
It falls in the borderline high band of 160 to 189 mg/dL, and whether it needs treating depends entirely on your risk tier. At low risk the target is 190, so 165 clears it. At moderate risk the target is 160 and you are 5 mg/dL over. At high risk the target is 130 and you are 35 mg/dL over. A 165 in someone with a prior heart attack is 65 mg/dL above the 100 mg/dL goal and would usually prompt a treatment change.
Do I need to fast for a non-HDL cholesterol test?
No. Total cholesterol and HDL barely change after a meal, so the subtraction that produces non-HDL holds on a non-fasting sample. Calculated LDL is different because it depends on triglycerides, which can rise 20 to 30 percent after eating. This is one of the practical reasons European guidelines moved toward non-fasting lipid panels as the default.
Can I still calculate non-HDL if my triglycerides are over 400?
Yes, and this is where non-HDL earns its place. The Friedewald equation assumes a fixed 5 to 1 triglyceride-to-cholesterol ratio inside VLDL, and above roughly 400 mg/dL that assumption fails, so most labs stop reporting a calculated LDL entirely. Non-HDL never uses triglycerides, so it stays valid at any level. A blank LDL field on a lab report is not reassurance, and non-HDL is the number your clinician will read instead.
What is the difference between non-HDL cholesterol and LDL?
LDL counts cholesterol in one particle type. Non-HDL counts cholesterol in every particle that can build plaque, which adds VLDL, IDL, chylomicron remnants and lipoprotein(a) to the LDL total. The gap between them is remnant cholesterol. Someone with LDL 125 and non-HDL 165 carries 40 mg/dL of remnant cholesterol that an LDL-only reading never counts, and remnant cholesterol above 30 mg/dL has been linked to raised ischaemic heart disease risk independently of LDL.
Related Calculators

A1C Calculator — Convert HbA1c to eAG with Targets
Use our A1C calculator to convert HbA1c to estimated average glucose (eAG). See normal, prediabetes, and diabetes thresholds in mg/dL and mmol/L. Fast results.
Albumin Calculator — Serum Albumin Level Interpretation
Free albumin calculator to interpret serum albumin levels, grade hypoalbuminemia, and compute A/G ratio plus albumin-corrected calcium from your lab results.
Albumin-Corrected Anion Gap Calculator — Hidden Acidosis
Use our albumin-corrected anion gap calculator to raise the anion gap by 2.5 per 1 g/dL of low albumin and reveal a hidden high-gap metabolic acidosis.

ANC Calculator: Absolute Neutrophil Count & Neutropenia
Free ANC calculator to calculate absolute neutrophil count from WBC and differential. Get ANC in cells/uL and x10^9/L with instant neutropenia grading.
Anion Gap Calculator — Metabolic Acidosis Evaluation
Free anion gap calculator finds serum anion gap from sodium, chloride, and bicarbonate, with albumin correction and delta ratio for metabolic acidosis.
AST/ALT Ratio Calculator — Free De Ritis Ratio Tool
Use our free AST/ALT ratio calculator to compute the De Ritis index instantly. Visual ratio chart, enzyme-level assessment, and clinical patterns guide.