Use the Neutrophil-to-Lymphocyte Ratio Calculator
Use our neutrophil-to-lymphocyte ratio calculator (NLR) to divide absolute neutrophils by lymphocytes as an inflammation and prognosis marker from a CBC.
NLR Result
2.00
Often listed as “Neut#” or “ANC”. Typical adult: 1.5–7.5 ×10⁹/L
Often listed as “Lymph#” or “ALC”. Typical adult: 1.0–4.0 ×10⁹/L
Add your platelet count to also get the PLR and SII inflammation indices
Formula: NLR = Neutrophils ÷ Lymphocytes = 4.2 ÷ 2.1 = 2.00
Neutrophil-to-Lymphocyte Ratio (NLR)
2.00
4.20 ÷ 2.10 ×10⁹/L
Borderline. May reflect low-grade or subclinical inflammation, mild stress, smoking, or normal variation.
NLR
2.00
Neutrophils (×10⁹/L)
4.20
Lymphocytes (×10⁹/L)
2.10
NLR Interpretation Bands
Adult gradation per Zahorec (2021) — cutoffs are guides, not diagnoses
Medical Disclaimer
This NLR calculator is for educational purposes only and does not provide a diagnosis. A single elevated ratio can reflect temporary stress, steroids, or recent illness — trends matter more than one value. Always review CBC results with your clinician.
Educational tool, not medical advice. Check this tool’s method and limitations before interpreting a result. Talk to a qualified healthcare professional before making decisions about medication, diet, exercise, or treatment. See our Terms of Use.
Your rating helps improve Neutrophil-to-Lymphocyte Ratio Calculator. We store only an anonymized vote (no personal data).
How to Use Neutrophil-to-Lymphocyte Ratio Calculator
Step 1: Choose an input mode
Pick "Absolute counts" if your CBC lists Neut# and Lymph#, or "Percentages" if the report only shows the differential percentages.
Step 2: Enter neutrophils and lymphocytes
Type the absolute neutrophil and lymphocyte counts (or the two percentages) exactly as they appear on your CBC report.
Step 3: Match units and add platelets
Toggle between ×10⁹/L and cells/µL to match your lab, and optionally enter your platelet count to unlock the PLR and SII indices.
Step 4: Read the color-coded result
Your NLR appears instantly with an interpretation band from normal (1–2) through gray zone (2–3) up to critical (above 17).
Step 5: Copy and compare
Use the Copy Summary button to save your values, then check the reference band table to see where your ratio falls.
Key Features
- Computes NLR from absolute counts or differential percentages
- Optional platelet input adds PLR and SII companion indices
- Seven-band Zahorec interpretation scale from normal to critical
- Unit toggle between ×10⁹/L and cells/µL
- Color-coded zone bar with copy-ready result summary
Understanding Results
Formula
NLR = absolute neutrophil count ÷ absolute lymphocyte count, both taken from the same CBC differential. Because the total white cell count appears in both absolute values, the ratio can equally be computed from percentages alone: neutrophil % ÷ lymphocyte %. With a platelet count added, the calculator also derives the platelet-to-lymphocyte ratio (PLR = platelets ÷ lymphocytes) and the systemic immune-inflammation index (SII = platelets × NLR), and in percentage mode with a WBC entered it reports the derived NLR (dNLR = neutrophils ÷ (WBC − neutrophils)).
Reference Ranges & Interpretation
Healthy adults average an NLR of about 1.65, with 95% of values between 0.78 and 3.53 per Forget et al. (2017). The interpretation bands used here follow the gradation proposed by Zahorec (2021): 1–2 normal, 2–3 gray zone, 3–7 mild elevation, 7–11 moderate, 11–17 severe, and above 17 critical. These bands grade the intensity of the body's stress response — they do not identify its cause.
Assumptions & Limitations
The ratio assumes both cell lines respond freely to stress signals, so it misleads on corticosteroids (which can push a normal NLR past 8 within hours), in children under about 4 years (lymphocyte predominance is normal), in the third trimester of pregnancy (means near 3 are physiologic), and in hematologic conditions such as chronic lymphocytic leukemia or chronic lymphopenia. Adult cutoffs also shift downward in benign ethnic neutropenia. A single elevated value drawn during acute stress is expected physiology — trends across repeat CBCs are far more informative, and any persistent elevation belongs in a conversation with your clinician.
Complete Guide: Neutrophil-to-Lymphocyte Ratio Calculator
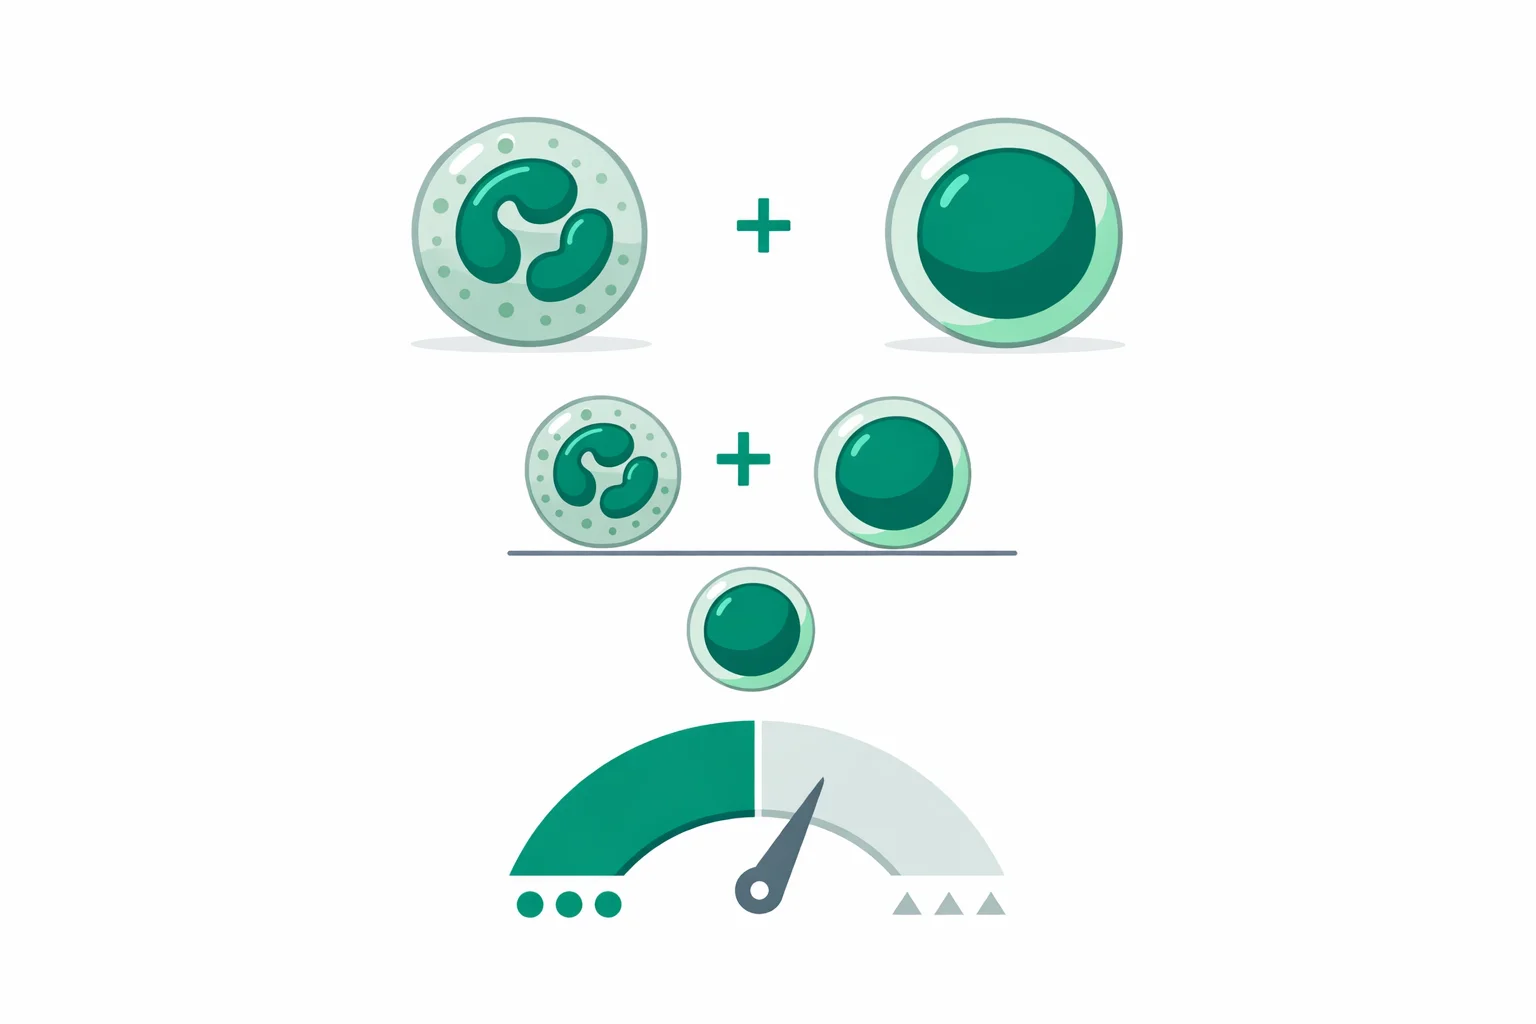
A neutrophil to lymphocyte ratio calculator extracts an inflammation marker that has already been paid for. Every complete blood count with differential — and labs run billions of them each year — contains the two numbers needed to compute the NLR, yet most reports never print the ratio itself. That's a strange omission, because since Zahorec first proposed it in 2001, the NLR has accumulated evidence as a prognostic signal across sepsis, solid tumors, heart disease, and COVID-19, all from a single division: absolute neutrophils ÷ absolute lymphocytes. This guide explains what the ratio physiologically measures, how to compute it two different ways from any CBC printout, what the interpretation bands from 1 to 17+ actually mean, and the six common situations where the number misleads.
Table of contents
- The two cell lines behind one ratio
- One division, two ways to do it
- From 1 to 17: the Zahorec interpretation bands
- Why stress and steroids raise NLR without infection
- NLR vs. CRP: speed, cost, and what each one sees
- What an NLR above 4 predicts
- Six situations that break the ratio
- What to do with your neutrophil to lymphocyte ratio calculator result
The Two Cell Lines Behind One Ratio
Neutrophils and lymphocytes sit on opposite ends of the immune system, and stress pushes them in opposite directions. Neutrophils are the innate arm's first responders — short-lived cells (circulating half-life around 7–10 hours) that surge when cortisol and catecholamines signal danger. Lymphocytes run the adaptive arm — the T cells, B cells, and NK cells that manage targeted, longer-term responses. The same cortisol that mobilizes neutrophils simultaneously drives lymphocytes out of circulation and into lymphoid tissue, and promotes lymphocyte apoptosis. So during systemic stress, the numerator rises while the denominator falls.
That double movement is what makes the ratio more sensitive than either count alone. A neutrophil count that climbs from 4.0 to 6.0 ×10⁹/L stays inside the normal 1.5–7.5 range and triggers no flag on the lab report. If lymphocytes drop from 2.0 to 1.0 at the same time — also technically within range — the NLR has jumped from 2.0 to 6.0, tripling while both individual counts read "normal." In healthy adults, the ratio clusters tightly: a study of 413 healthy subjects put the mean at about 1.65, with 95% of values between 0.78 and 3.53.
One Division, Two Ways to Do It
The standard route uses absolute counts. Find the lines on your CBC labeled "Neut#", "ANC", or "absolute neutrophils" and "Lymph#" or "ALC", then divide: NLR = absolute neutrophils ÷ absolute lymphocytes. With neutrophils of 4.2 ×10⁹/L and lymphocytes of 2.1 ×10⁹/L, the NLR is 4.2 ÷ 2.1 = 2.0. Units cancel, so it works identically whether your lab reports ×10⁹/L or cells/µL — 4,200 ÷ 2,100 gives the same 2.0. If your report only lists a total WBC with percentages, our absolute neutrophil count calculator converts the percentage back into the absolute figure.
The second route is a shortcut many people miss: the ratio of percentages equals the ratio of absolute counts, because the total WBC appears in both and cancels out. Neutrophils 60% and lymphocytes 30% means NLR = 60 ÷ 30 = 2.0 — no WBC needed. This matters in practice because some older lab printouts show only the differential percentages. One caution: use lab percentages, not eyeballed estimates, and never mix one report's neutrophil value with another report's lymphocyte value. The ratio is only meaningful when both cells come from the same blood draw.
From 1 to 17: The Zahorec Interpretation Bands
Rastislav Zahorec, the Slovak intensivist who introduced the ratio while tracking oncology ICU patients, published a widely cited gradation in 2021 that maps NLR values to the severity of the underlying stress response. The bands below follow that scheme. They describe intensity of physiologic stress — they don't name a cause, which always requires clinical context.
| NLR | Band | Typical context |
|---|---|---|
| < 1 | Below typical | Normal in children ~6 months to 4 years; in adults, think viral infection or a low neutrophil count |
| 1–2 | Normal | Healthy adult baseline (population mean ≈ 1.65) |
| 2–3 | Gray zone | Subclinical inflammation, smoking, obesity, aging — or nothing at all |
| 3–7 | Mild elevation | Mild-to-moderate inflammation or stress: infections, flares, recent surgery, steroids, late pregnancy |
| 7–11 | Moderate elevation | Significant systemic inflammation; in the right context raises concern for serious bacterial infection |
| 11–17 | Severe elevation | Severe stress: sepsis, major trauma, extensive burns — typically an inpatient finding |
| > 17 | Critical range | Critical illness such as septic shock; associated with high mortality in ICU cohorts |
Notice how compressed the healthy end is. The entire distance between a textbook-normal 1.6 and a worrying 7 spans less than the gap between two "normal" WBC results of 5 and 11 ×10⁹/L. That compression is why a ratio of 4 or 5 deserves attention even when every individual line on the CBC sits inside its reference interval.
Why Stress and Steroids Raise NLR Without Any Infection
Roughly half of the body's mature neutrophils aren't circulating at any given moment — they're marginated, rolling along vessel walls or parked in the lungs and spleen. Cortisol and adrenaline release them into the bloodstream within hours, no new cell production required. A single dose of prednisone can raise the neutrophil count by 2–5 ×10⁹/L within 4–6 hours while cutting lymphocytes by up to 70%, which can push a baseline NLR of 2 past 8 in an afternoon without any infection anywhere.
The same demargination physiology follows hard exercise, panic attacks, seizures, heart attacks, and even a difficult night shift. A marathon can transiently double the ratio for 6–24 hours. This is the single most common interpretation error with this marker: treating one elevated NLR drawn during an acutely stressful moment as evidence of hidden disease. If the draw happened in an emergency department, after steroids, or the morning after strenuous exercise, an elevated ratio is the expected physiology — the informative test is the repeat CBC after the stressor clears.
NLR vs. CRP: Speed, Cost, and What Each One Sees
C-reactive protein is the inflammation marker most people know, so it's the natural benchmark. The two differ mainly in kinetics and cost. NLR moves first: the neutrophil surge and lymphocyte dip begin within about 6 hours of an inflammatory insult. CRP is a liver protein that needs to be synthesized — it starts rising around 4–6 hours but doesn't peak until 36–50 hours. In the first day of an evolving infection, the ratio can be loudly abnormal while CRP still reads single digits. CRP then holds its plateau longer, making it better for tracking treatment response over days.
Cost is the more practical difference. CRP is a separate send-out on most panels; the NLR is free arithmetic on a CBC that was ordered anyway. Related CBC-derived cousins extend the same idea: the platelet-to-lymphocyte ratio (PLR, typically 90–210 in health) and the systemic immune-inflammation index (SII = platelets × NLR) fold your platelet count into the picture, since platelets act as inflammation reactants too. Our calculator computes both automatically when you add a platelet value.
What an NLR Above 4 Predicts
The reason this ratio escaped the ICU and entered general practice is its prognostic track record. The landmark 2014 meta-analysis by Templeton and colleagues pooled 100 studies covering roughly 40,000 patients with solid tumors: an NLR above the study cutoff (median 4) was associated with a hazard ratio of 1.81 for overall mortality — nearly double the risk, consistent across cancer types and disease stages. In cardiology, elevated NLR tracks with worse outcomes after myocardial infarction and in heart failure. During the COVID-19 pandemic it became a triage tool: meta-analyses found admission NLR values above roughly 6.5 predicted severe disease, and early studies flagged risk from about 3.3 upward.
Two honest caveats belong next to that evidence. First, these are population-level associations — an individual NLR of 4.5 is not a personal prognosis, and cutoffs vary between studies precisely because the ratio is continuous. Second, prognostic markers travel in packs: clinicians read NLR alongside markers like serum albumin, which falls during sustained inflammation and anchors composite scores such as the Glasgow Prognostic Score. No single ratio carries a prognosis by itself.
Six Situations That Break the Ratio
The NLR assumes both cell lines are free to respond normally to stress signals. These six situations violate that assumption:
- Young children. From roughly 6 months to 4 years, lymphocytes normally outnumber neutrophils, so an NLR below 1 is expected — adult bands simply don't apply.
- Pregnancy. The ratio climbs physiologically each trimester, reaching a mean around 3 in the third trimester. A "mild elevation" reading late in pregnancy is usually just pregnancy.
- Benign ethnic neutropenia. People with the Duffy-null phenotype — common in African and some Middle Eastern ancestries — run baseline neutrophil counts 25–50% lower, dragging the NLR down without any immune deficit.
- Hematologic malignancies. Chronic lymphocytic leukemia inflates lymphocytes above 5 ×10⁹/L and collapses the ratio; myeloid leukemias distort the numerator. NLR is uninterpretable in these settings.
- Chronic lymphopenia. Untreated HIV, chemotherapy, and immunosuppressants shrink the denominator persistently, inflating every subsequent NLR regardless of what the neutrophils do.
- Active steroid therapy. As covered above, corticosteroids move both cell lines in ratio-raising directions within hours. An NLR drawn on prednisone reflects the drug, not the disease.
What to Do With Your Neutrophil to Lymphocyte Ratio Calculator Result
If your NLR sits between 1 and 3 and you feel well, there's nothing to act on — that spans the normal band and the gray zone where healthy smokers, older adults, and people carrying extra weight commonly land. For a value between 3 and 7 without an obvious explanation (no recent illness, steroids, hard training, or late pregnancy), the highest-yield move is simply a repeat CBC in 4–6 weeks: a ratio that returns to 2 was a transient stress response, while one that persists above 3–4 is worth bringing to your clinician alongside symptoms, medications, and the rest of the differential. Values above 7 that weren't drawn during an acute illness deserve a conversation promptly rather than a recheck later. And in every case, the trend across two or three draws tells you more than any single number — which is exactly why a ratio you can compute from every routine CBC is worth knowing about.
References
- Zahorec R. Neutrophil-to-lymphocyte ratio, past, present and future perspectives. Bratislava Medical Journal. 2021;122(7):474–488. PubMed
- Forget P, et al. What is the normal value of the neutrophil-to-lymphocyte ratio? BMC Research Notes. 2017;10:12. PMC
- Templeton AJ, et al. Prognostic role of neutrophil-to-lymphocyte ratio in solid tumors: a systematic review and meta-analysis. Journal of the National Cancer Institute. 2014;106(6):dju124. PubMed

Written by Jurica Šinko
Founder & CEO
Entrepreneur and health information advocate, passionate about making health calculations accessible to everyone through intuitive digital tools.
View full profileFrequently Asked Questions
What is a normal neutrophil-to-lymphocyte ratio?
In healthy adults the NLR clusters between 1 and 2, with a population mean of about 1.65. A study of 413 healthy subjects found 95% of values fell between 0.78 and 3.53, so results between 2 and 3 sit in a gray zone that can reflect smoking, aging, extra weight, or nothing at all.
Is an NLR of 4 high?
An NLR of 4 falls in the mild elevation band (3–7) of the Zahorec gradation. It commonly reflects an active infection, corticosteroids, recent surgery, hard exercise, or late pregnancy. If none of those apply, repeat the CBC in 4–6 weeks — a ratio that stays above 3–4 is worth discussing with your clinician.
How do I calculate NLR from a CBC report?
Divide the absolute neutrophil count by the absolute lymphocyte count — for example 4.2 ÷ 2.1 = 2.0. If your report only shows percentages, divide neutrophil % by lymphocyte % instead; the total WBC cancels out of the ratio, so 60% ÷ 30% gives the same 2.0.
What NLR level suggests sepsis?
Values of 11–17 indicate severe physiologic stress and ratios above 17 are typical of critical illness such as septic shock, per the Zahorec 2021 gradation. No NLR value diagnoses sepsis on its own — clinicians combine it with vital signs, lactate, and culture results.
Does prednisone raise the neutrophil-to-lymphocyte ratio?
Yes, strongly. Corticosteroids release marginated neutrophils into circulation within 4–6 hours while cutting lymphocytes by up to 70%, so a baseline NLR of 2 can exceed 8 on steroids with no infection present. Wait until the course ends before reading the ratio as an inflammation marker.
What is the difference between NLR and dNLR?
The derived NLR (dNLR) divides neutrophils by the white cells that are not neutrophils — WBC minus the neutrophil count — instead of by lymphocytes alone. It was designed for datasets missing lymphocyte counts, and its values run lower: study cutoffs sit around 2–3 for dNLR versus 3–4 for the standard NLR.
Why is my NLR below 1?
An NLR under 1 means lymphocytes outnumber neutrophils. That pattern is normal in children between about 6 months and 4 years of age. In adults it usually points to a viral infection or a low neutrophil count — including benign ethnic neutropenia, which lowers baseline neutrophils by 25–50% in people with the Duffy-null phenotype.
Is NLR better than CRP for detecting inflammation?
They answer different questions. NLR shifts within about 6 hours of an inflammatory insult, while CRP peaks at 36–50 hours, so the ratio moves earlier but CRP tracks resolution over days better. NLR is also free with any CBC differential, whereas CRP requires a separate test.
Related Calculators

A1C Calculator — Convert HbA1c to eAG with Targets
Use our A1C calculator to convert HbA1c to estimated average glucose (eAG). See normal, prediabetes, and diabetes thresholds in mg/dL and mmol/L. Fast results.

Albumin Calculator — Serum Albumin Level Interpretation
Free albumin calculator to interpret serum albumin levels, grade hypoalbuminemia, and compute A/G ratio plus albumin-corrected calcium from your lab results.
Albumin-Corrected Anion Gap Calculator — Hidden Acidosis
Use our albumin-corrected anion gap calculator to raise the anion gap by 2.5 per 1 g/dL of low albumin and reveal a hidden high-gap metabolic acidosis.

ANC Calculator: Absolute Neutrophil Count & Neutropenia
Free ANC calculator to calculate absolute neutrophil count from WBC and differential. Get ANC in cells/uL and x10^9/L with instant neutropenia grading.

Anion Gap Calculator — Metabolic Acidosis Evaluation
Free anion gap calculator finds serum anion gap from sodium, chloride, and bicarbonate, with albumin correction and delta ratio for metabolic acidosis.
AST/ALT Ratio Calculator — Free De Ritis Ratio Tool
Use our free AST/ALT ratio calculator to compute the De Ritis index instantly. Visual ratio chart, enzyme-level assessment, and clinical patterns guide.