Use the Mean Arterial Pressure Calculator
Free mean arterial pressure calculator to find MAP from systolic and diastolic blood pressure. Check whether organ perfusion is adequate using the MAP formula.
MAP
93.3 mmHg
Peak pressure while the heart contracts
Pressure between beats — weighted double in MAP
Adds a rate-corrected MAP for fast heart rates
Mean arterial pressure
93.3 mmHg
Within the typical adult resting range of 70–100 mmHg — adequate driving pressure for organ perfusion.
Pulse pressure
40 mmHg
Typical (~40 mmHg at rest)
Distance from 65 floor
+28.3 mmHg
vs. the 65 mmHg perfusion target
HR-adjusted MAP
—
Enter a heart rate to rate-correct the estimate
How your MAP is built
MAP reference ranges (resting adults)
| MAP (mmHg) | Zone | What it means |
|---|---|---|
| Below 60 | Critically low | Organ perfusion at risk; urgent in monitored settings |
| 60 – 64 | Below target | Under the 65 mmHg resuscitation floor |
| 65 – 69 | Low-normal | At or just above the minimum perfusion target |
| 70 – 100 | Normal ← | Typical adult resting range |
| 101 – 110 | Elevated | Often accompanies stage 1–2 hypertension |
| Above 110 | High | Consistent with sustained hypertension |
This tool estimates MAP from a cuff reading for education only. It assumes a resting heart rate and regular rhythm — the estimate drifts in atrial fibrillation, severe tachycardia, and aortic valve disease. A sustained MAP below 65 mmHg with symptoms, or any reading of 180/120 mmHg or higher, warrants prompt medical attention.
Educational tool, not medical advice. Check this tool’s method and limitations before interpreting a result. Talk to a qualified healthcare professional before making decisions about medication, diet, exercise, or treatment. See our Terms of Use.
Your rating helps improve Mean Arterial Pressure Calculator. We store only an anonymized vote (no personal data).
How to Use Mean Arterial Pressure Calculator
Step 1: Enter your systolic pressure
Type the top number of your blood pressure reading (for example, 120) into the Systolic field in mmHg.
Step 2: Enter your diastolic pressure
Type the bottom number (for example, 80) into the Diastolic field. MAP calculates instantly — no button needed.
Step 3: Add your heart rate (optional)
Enter your pulse in bpm to see a heart-rate-adjusted MAP, which corrects the standard formula during tachycardia.
Step 4: Read the perfusion gauge
Check where your MAP lands: below 60 mmHg signals hypoperfusion risk, 65 is the ICU target floor, and 70-100 is the normal adult range.
Step 5: Copy your summary
Use the Copy summary button to save your MAP, pulse pressure, and zone for your records or a telehealth visit.
Key Features
- Instant MAP from any systolic/diastolic reading
- Heart-rate-adjusted MAP for fast heart rates
- Perfusion zones with the 65 mmHg target marked
- Pulse pressure with narrow/wide flag
- Visual gauge and MAP composition breakdown
- Copy-ready summary for records or telehealth
Understanding Results
Formula
MAP = diastolic + (systolic − diastolic) ÷ 3, equivalently (systolic + 2 × diastolic) ÷ 3. Diastolic is weighted double because the heart spends about two-thirds of each cardiac cycle in diastole at resting rates. For 120/80: pulse pressure is 40 mmHg, one-third of that is 13.3, so MAP = 93.3 mmHg. With a heart rate entered, the calculator also shows the rate-corrected estimate MAP = diastolic + (0.33 + 0.0012 × HR) × pulse pressure, which tracks invasive measurement better during tachycardia.
Reference Ranges & Interpretation
Typical resting adult MAP is 70–100 mmHg. The Surviving Sepsis Campaign guidelines set 65 mmHg as the initial resuscitation floor, and values below 60 mmHg fall under the autoregulation range where the brain and kidneys can no longer hold their blood flow steady (see StatPearls: Physiology, Mean Arterial Pressure). A MAP above 110 mmHg usually accompanies stage 2 hypertension and deserves repeat readings on separate days.
Assumptions & Limitations
The one-third rule assumes a regular rhythm and a resting heart rate — it drifts upward of 5 mmHg during tachycardia and loses meaning in atrial fibrillation, where beat-to-beat stroke volume varies (average at least three readings). Wide-pulse-pressure states like aortic regurgitation can produce a numerically normal MAP from an abnormal circulation, and pediatric norms differ entirely from the adult zones shown here. This tool is educational and does not replace clinical measurement; a sustained MAP below 65 mmHg with symptoms, or any reading of 180/120 mmHg or higher, warrants prompt medical attention.
Complete Guide: Mean Arterial Pressure Calculator
On this page
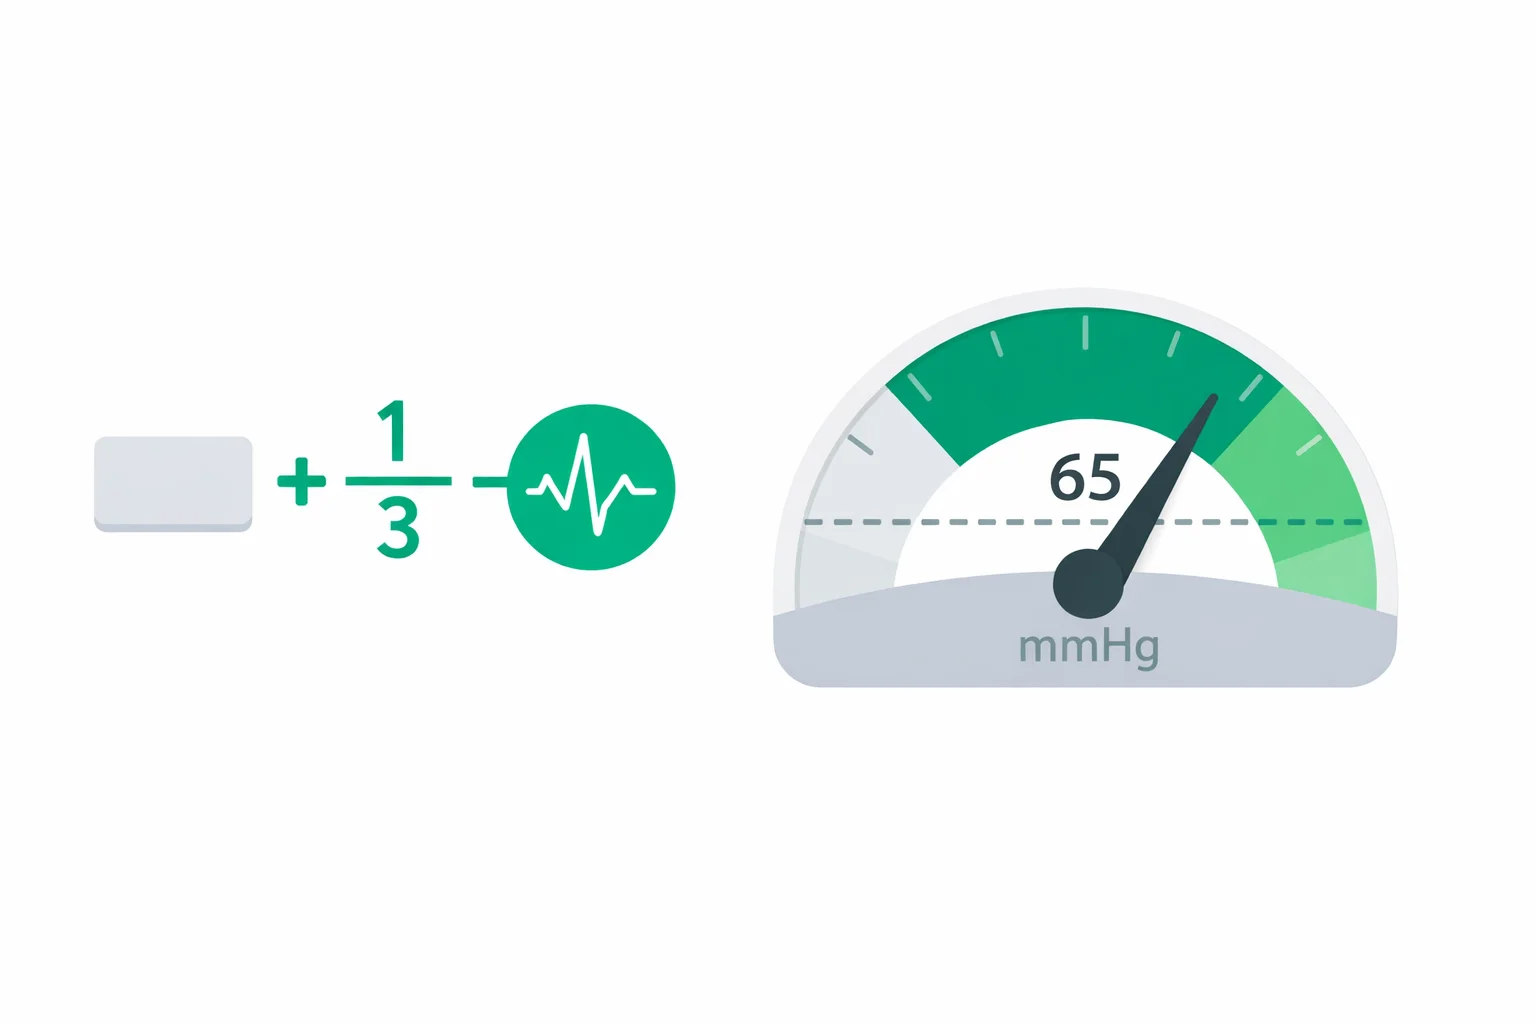
A mean arterial pressure calculator turns an ordinary blood pressure reading — say 120/80 mmHg — into the one number your organs actually feel: about 93 mmHg of average driving pressure. Neither 120 nor 80 tells you that on its own. Systolic is a brief peak, diastolic a trough, and your kidneys, brain, and gut are perfused by the time-weighted average between them. That average is MAP, and it is the number ICU teams titrate vasopressors against, minute by minute. This guide shows the formula and a worked example, explains why the famous 65 mmHg floor exists, and covers the situations — fast heart rates, irregular rhythms, leaky aortic valves — where the simple estimate quietly stops being true.
Systolic vs. MAP: Which Number Do Your Organs Actually Feel?
Most people fixate on the top number. Clinicians watching a monitor mostly don't. The reason is autoregulation: the brain and kidneys hold their blood flow roughly constant as long as MAP stays inside a window of about 60 to 150 mmHg. Below that window, flow falls with pressure — perfusion becomes a straight-line function of MAP, not of systolic. Intraoperative data make the stakes concrete: in a cohort of 33,330 surgeries, spending even 1 to 5 minutes with a MAP under 55 mmHg was associated with measurably higher rates of acute kidney injury and myocardial injury afterward.
Here's the part that surprises people: two very different readings can produce an identical MAP. A reading of 110/85 and a reading of 140/70 both work out to 93.3 mmHg. Perfusion pressure is the same; the profiles are not — the second reading carries a 70 mmHg pulse pressure that raises its own questions about arterial stiffness. That's why MAP complements rather than replaces the standard AHA categories you get from a blood pressure calculator: one grades the reading, the other measures the driving force behind it.
The Mean Arterial Pressure Calculator Formula, Worked Through
The standard formula is MAP = diastolic + (pulse pressure ÷ 3), where pulse pressure is simply systolic minus diastolic. You'll also see it written as (systolic + 2 × diastolic) ÷ 3 — the two forms are algebraically identical. Diastolic counts twice because, at a resting heart rate near 60 beats per minute, the heart spends roughly two-thirds of each cardiac cycle in diastole. The average pressure over a full beat therefore sits much closer to the bottom number than the top one.
Take 120/80 step by step. Pulse pressure: 120 − 80 = 40 mmHg. One-third of that: 13.3 mmHg. Add it to the diastolic base: 80 + 13.3 = 93.3 mmHg — comfortably inside the typical adult range of 70 to 100. Now a hypotensive example: 86/54. Pulse pressure is 32, a third of it 10.7, so MAP = 64.7 mmHg. That reading sits just under the 65 mmHg resuscitation floor even though the systolic, at 86, might not look alarming at a glance. The calculator above does this arithmetic instantly and flags exactly where the result lands.
Cuff Estimate vs. Arterial Line: When the Formula Drifts
An arterial line computes true MAP by integrating the pressure waveform — no assumptions involved. Home cuffs are odder than most people realize: an oscillometric monitor actually detects MAP first, at the point of maximal cuff oscillation, then estimates systolic and diastolic from it with proprietary algorithms. The one-third formula is the weakest of the three, because it hard-codes an assumption that diastole occupies two-thirds of the beat. Speed the heart up and diastole shrinks; the true mean climbs toward the middle of the pressure range while the formula stays put.
Razminia and colleagues validated a rate-corrected version against invasive measurement: MAP = diastolic + (0.33 + 0.0012 × heart rate) × pulse pressure. For 120/80 at 60 bpm that gives 96.1 mmHg; at 120 bpm it gives 99.0 mmHg, while the uncorrected formula reports 93.3 in both cases. A 5 or 6 mmHg gap is trivial in a healthy adult but decisive when a septic patient is hovering at the 65 mmHg line with a pulse of 130. Enter your resting pulse in the calculator's optional field to see both numbers side by side — and if you don't know your resting rate, measure it first with our heart rate monitor guide.
Where the 65 mmHg Target Comes From
The Surviving Sepsis Campaign recommends an initial MAP target of 65 mmHg for adults in septic shock on vasopressors — a strong recommendation, and one of the few blood pressure numbers with a dedicated randomized trial behind it. SEPSISPAM (published in the New England Journal of Medicine, 2014) randomized 776 septic shock patients to a MAP target of 65–70 versus 80–85 mmHg. Twenty-eight-day mortality was statistically indistinguishable: 36.6% in the high-target group versus 34.0% in the low-target group. Pushing pressure higher with more vasopressor wasn't free, either — new-onset atrial fibrillation occurred in 6.7% of high-target patients versus 2.8% at the lower target.
One subgroup complicates the story. Patients with chronic hypertension needed less renal replacement therapy at the higher target — their autoregulation curves have shifted rightward after years of elevated pressure, so a MAP that suits a 25-year-old may underperfuse their kidneys. The practical translation: 65 is a floor, not a universal goal, and clinicians routinely individualize upward for long-standing hypertensives. For a home user, the takeaway is simpler — a calculated MAP persistently near or below 65 deserves a conversation with a clinician, especially with symptoms like lightheadedness on standing.
What Common Readings Convert To
The table below runs the formula across the readings people actually get. Notice how a textbook-low 90/60 lands exactly at 70 — the bottom edge of normal — and how the stage 2 hypertension threshold of 140/90 already pushes MAP past 105.
| Reading (mmHg) | Pulse pressure | MAP | Zone |
|---|---|---|---|
| 90/60 | 30 | 70.0 | Low edge of normal |
| 100/65 | 35 | 76.7 | Normal |
| 110/70 | 40 | 83.3 | Normal |
| 120/80 | 40 | 93.3 | Normal |
| 130/85 | 45 | 100.0 | Upper edge of normal |
| 140/90 | 50 | 106.7 | Elevated |
| 160/100 | 60 | 120.0 | High |
| 180/110 | 70 | 133.3 | High — crisis-range reading |
Where the Formula Falls Apart: AF, Leaky Valves, and Newborns
Atrial fibrillation breaks the single-reading premise. Stroke volume changes beat to beat with an irregular rhythm, so consecutive cuff measurements can disagree by 10 mmHg or more. Average at least three readings before trusting any calculated MAP in AF. Aortic regurgitation breaks the formula differently: a leaking valve dumps diastolic pressure, producing readings like 150/50. Run the math and you get a "normal" MAP of 83.3 mmHg — arithmetically correct, hemodynamically misleading, because that 100 mmHg pulse pressure is itself the abnormal finding.
Age blunts the formula in a quieter way. Because stiffening arteries push systolic up while diastolic falls after roughly age 50, MAP can stay flat across two decades while pulse pressure widens from about 46 to 67 mmHg — the number that actually changed is the one MAP hides. The blood pressure by age calculator charts both curves from 18 to 85 and reports your pulse pressure against the average for your age.
Children are a separate reference world. Adult zones simply don't apply — a healthy toddler lives at a MAP an adult ICU would treat. Neonatology uses a blunt rule of thumb: a premature newborn's minimum acceptable MAP in mmHg approximately equals gestational age in weeks, so a 28-week preemie is expected to hold a MAP of at least 28. And in patients on continuous-flow support devices (an LVAD, or a balloon pump timed to the cardiac cycle) there may be little or no pulse at all — MAP then comes from a Doppler opening pressure or an arterial line, never from this formula.
What to Do With Your Number
Use MAP as a trend, not a verdict. If yours computes below 65: recheck with proper technique — seated, back supported, arm at heart level, after 5 quiet minutes — because a slouched position alone can shift a reading by 5 to 10 mmHg. A low-normal MAP of 65 to 70 in a young, asymptomatic adult (distance runners are the classic case) is usually just physiology. Low MAP plus symptoms — dizziness on standing, cold hands and feet, unusual fatigue — is worth a medication review with your prescriber; antihypertensives, diuretics, and alpha-blockers are frequent culprits. Persistent MAP above 110 carries the same urgency as stage 2 hypertension, because it usually is stage 2 hypertension wearing different clothes.
Perfusion is also a two-variable story: pressure pushes blood in, and oxygen content decides what that blood delivers. If you're tracking MAP during an illness, pair it with a pulse oximeter reading and interpret both with our oxygen saturation calculator — a normal MAP with an SpO2 of 89% is not a reassuring picture. Log the pair once a day under the same conditions, and bring the trend line, not a single number, to your next appointment.
A resuscitation target and an organ-dysfunction cutoff serve different purposes. The original SOFA score calculator assigns 1 cardiovascular point for MAP below 70 mmHg without qualifying vasoactive support; a qualifying infusion can place the score in a higher band even when MAP has recovered.
References
- Evans L, Rhodes A, Alhazzani W, et al. Surviving Sepsis Campaign: International Guidelines for Management of Sepsis and Septic Shock 2021. Crit Care Med. 2021;49(11):e1063-e1143
- Asfar P, Meziani F, Hamel JF, et al. High versus Low Blood-Pressure Target in Patients with Septic Shock (SEPSISPAM). N Engl J Med. 2014;370:1583-1593
- DeMers D, Wachs D. Physiology, Mean Arterial Pressure. StatPearls, NCBI Bookshelf
- Razminia M, Trivedi A, Molnar J, et al. Validation of a new formula for mean arterial pressure calculation: the new formula is superior to the standard formula. Catheter Cardiovasc Interv. 2004;63(4):419-425.
- Walsh M, Devereaux PJ, Garg AX, et al. Relationship between intraoperative mean arterial pressure and clinical outcomes after noncardiac surgery. Anesthesiology. 2013;119(3):507-515.

Written by Jurica Šinko
Founder & CEO
Entrepreneur and health information advocate, passionate about making health calculations accessible to everyone through intuitive digital tools.
View full profileFrequently Asked Questions
How do you calculate MAP from 120/80?
Subtract diastolic from systolic to get pulse pressure: 120 minus 80 equals 40 mmHg. Divide by 3 to get 13.3, then add it to the diastolic: 80 plus 13.3 equals a MAP of 93.3 mmHg. The equivalent form (systolic plus 2 times diastolic) divided by 3 gives the same answer.
Is a MAP of 65 good enough?
A MAP of 65 mmHg is the minimum resuscitation target used in ICU care, not an ideal value. Healthy resting adults usually run 70-100 mmHg. The SEPSISPAM trial found no survival benefit from pushing septic shock patients to 80-85 mmHg instead of 65-70, but higher targets caused more atrial fibrillation, which is why 65 remains the floor.
What MAP is dangerously low?
A sustained MAP below 60 mmHg puts the brain and kidneys below their autoregulation range, and surgical data show even 1-5 minutes under 55 mmHg is linked to acute kidney injury and heart muscle injury. A home reading that low warrants rechecking with proper technique and, if it persists with symptoms like dizziness, prompt medical advice.
Why is diastolic pressure counted twice in the MAP formula?
At a resting heart rate near 60 bpm, the heart spends about two-thirds of each cardiac cycle in diastole and only one-third in systole. The formula (systolic plus 2 times diastolic) divided by 3 weights each phase by the time it actually occupies, which is why MAP sits closer to the bottom number.
Is the MAP formula accurate at high heart rates?
No. Diastole shortens as the heart speeds up, so the standard one-third rule underestimates the true mean. The validated rate-corrected version is MAP equals diastolic plus (0.33 plus 0.0012 times heart rate) times pulse pressure. For 120/80 that means 93.3 mmHg uncorrected versus about 99 mmHg at 120 bpm.
Can MAP be normal when blood pressure is abnormal?
Yes, and it happens regularly. A reading of 150/50 from a leaky aortic valve computes to a normal-looking MAP of 83.3 mmHg, yet the 100 mmHg pulse pressure is itself abnormal. Readings of 110/85 and 140/70 both give 93.3 mmHg. MAP measures average driving pressure, so it must be read alongside the full reading, not instead of it.
What is a normal MAP for adults?
Roughly 70-100 mmHg at rest. A 120/80 reading gives 93.3 mmHg, near the middle of that range. Values of 65-70 are common in young, lean, or very fit adults and are usually harmless without symptoms, while a MAP persistently above 110 mmHg generally tracks with stage 2 hypertension.
Do home blood pressure monitors measure MAP?
Oscillometric cuffs actually detect MAP first — it corresponds to the point of maximal cuff oscillation — and then derive systolic and diastolic from it using proprietary algorithms. Most consumer monitors never display the MAP they measured, which is why you need to calculate it from the two numbers shown.
Related Calculators

A1C Calculator — Convert HbA1c to eAG with Targets
Use our A1C calculator to convert HbA1c to estimated average glucose (eAG). See normal, prediabetes, and diabetes thresholds in mg/dL and mmol/L. Fast results.

Albumin Calculator — Serum Albumin Level Interpretation
Free albumin calculator to interpret serum albumin levels, grade hypoalbuminemia, and compute A/G ratio plus albumin-corrected calcium from your lab results.
Albumin-Corrected Anion Gap Calculator — Hidden Acidosis
Use our albumin-corrected anion gap calculator to raise the anion gap by 2.5 per 1 g/dL of low albumin and reveal a hidden high-gap metabolic acidosis.

ANC Calculator: Absolute Neutrophil Count & Neutropenia
Free ANC calculator to calculate absolute neutrophil count from WBC and differential. Get ANC in cells/uL and x10^9/L with instant neutropenia grading.

Anion Gap Calculator — Metabolic Acidosis Evaluation
Free anion gap calculator finds serum anion gap from sodium, chloride, and bicarbonate, with albumin correction and delta ratio for metabolic acidosis.

AST/ALT Ratio Calculator — Free De Ritis Ratio Tool
Use our free AST/ALT ratio calculator to compute the De Ritis index instantly. Visual ratio chart, enzyme-level assessment, and clinical patterns guide.