Use the Blood Pressure by Age Calculator
Free blood pressure by age calculator: see your percentile among adults your age and sex, plus a normal range chart of average readings from age 18 to 85.
Systolic percentile · age 45
55th
Adult reference curves cover ages 18–85
Reference curves differ by roughly 10 mmHg before age 60
Use an average of two seated readings, not a single spike
The age average for this number peaks near 50 and then falls
Your systolic vs. 45-year-old men
55th percentile
Higher than about 55% of men your age
Your systolic sits in the middle half of readings for your age and sex. Remember that average is not the same as optimal — roughly half of US adults over 60 already meet the definition of hypertension.
Average at 45
126/80
mmHg for men your age
Systolic gap
+2 mmHg
vs. your age average
Diastolic percentile
58th
+2 mmHg vs. age average
Pulse pressure
46 mmHg
age average 46 mmHg
Systolic age match
A systolic of 128 mmHg is the average for a 50-year-old man — 5 years older than you are.
This maps your reading onto the population age curve. It is a comparison, not a measurement of arterial age.
Blood pressure chart by age
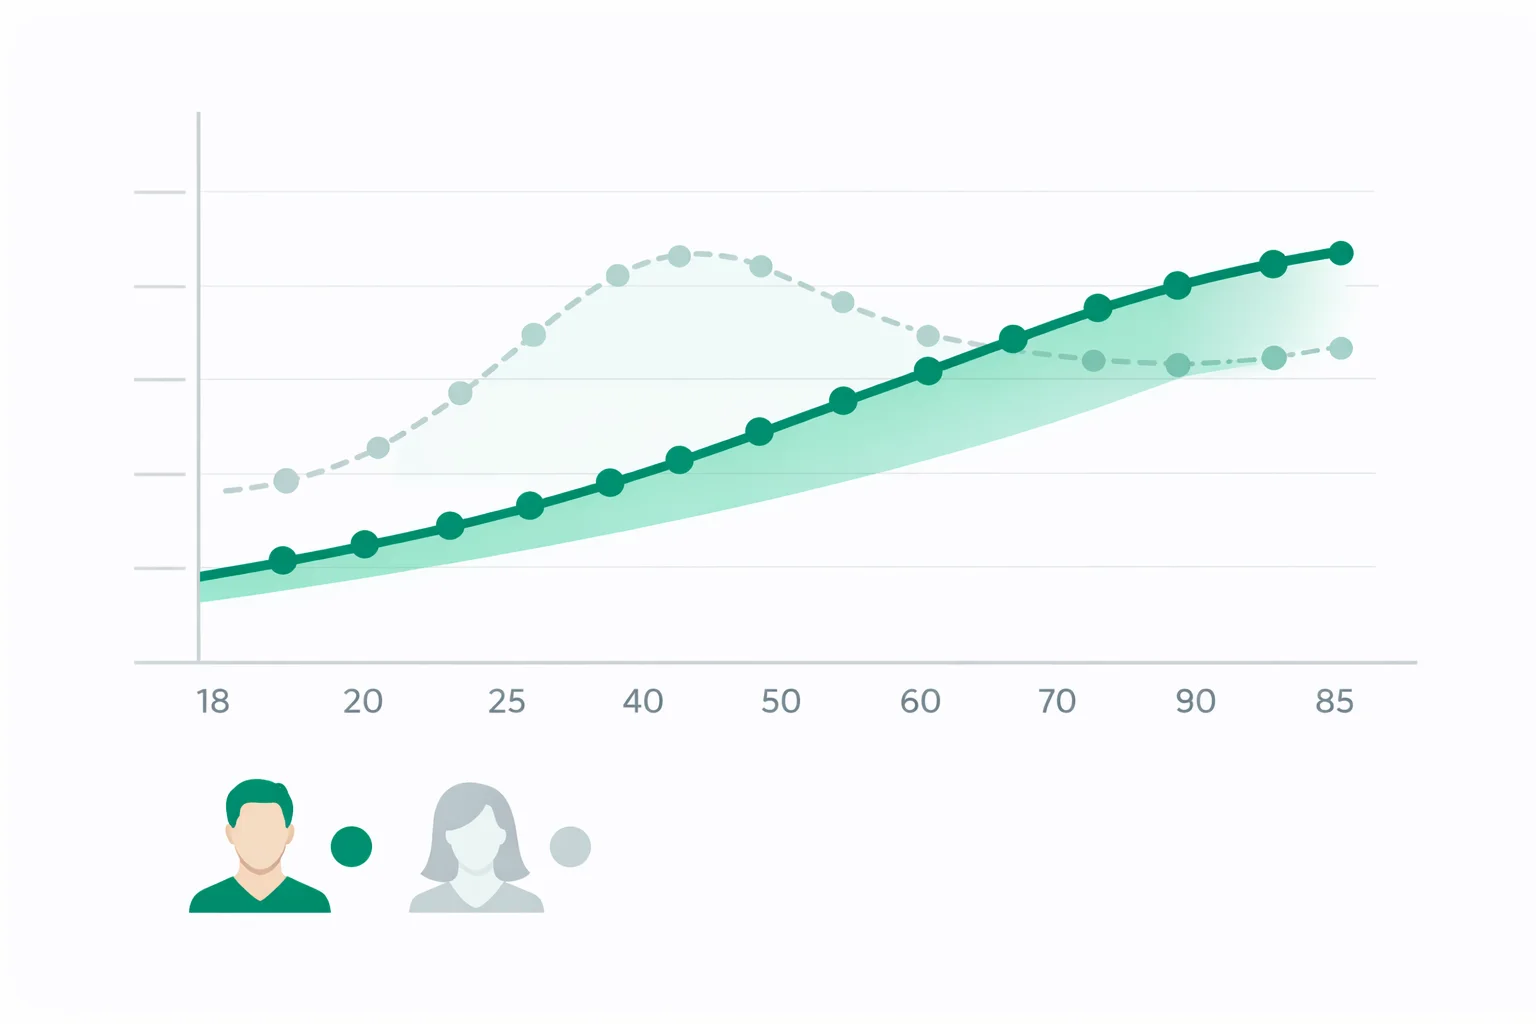
Note where the emerald line crosses the dashed 120 mmHg mark: the average adult passes the “normal” systolic ceiling in midlife, while the blue diastolic line turns downward after roughly age 50–55 as large arteries stiffen.
Average blood pressure by age and gender (mmHg)
| Age | Men | Women | Pulse pressure (M / W) |
|---|---|---|---|
| 18–24 | 120/69 | 110/66 | 52 / 44 |
| 25–34 | 122/74 | 112/70 | 48 / 42 |
| 35–44 | 124/78 | 116/74 | 46 / 42 |
| 45–54 ← | 128/81 | 123/78 | 47 / 45 |
| 55–64 | 132/80 | 130/77 | 52 / 53 |
| 65–74 | 136/76 | 136/74 | 60 / 62 |
| 75+ | 139/72 | 140/70 | 67 / 69 |
Women average roughly 10 mmHg lower systolic than men until the mid-50s, then overtake them after about age 65. Pulse pressure widens in both sexes — that widening, not the diastolic number, is the hallmark of arterial stiffening.
Average is not a target
Everything above compares you to other people. Diagnostic thresholds do not move with age: 130/80 mmHg is stage 1 hypertension at 25 and at 75 under the 2017 ACC/AHA guideline, even though it sits near the 50th percentile for a 60-year-old. To classify a single reading by stage instead of percentile, use the blood pressure calculator.
Percentiles come from population averages for US adults, modelled as a normal distribution around each age-and-sex mean. Real systolic distributions are right-skewed, so very high readings sit slightly higher than shown here. These curves describe measured populations including people already on medication, so they are a comparison tool, not a treatment target. A reading of 180/120 mmHg or higher needs prompt medical attention.
Educational tool, not medical advice. Check this tool’s method and limitations before interpreting a result. Talk to a qualified healthcare professional before making decisions about medication, diet, exercise, or treatment. See our Terms of Use.
Your rating helps improve Blood Pressure by Age Calculator. We store only an anonymized vote (no personal data).
How to Use Blood Pressure by Age Calculator
Step 1: Enter your age and sex
Type your age in the Age field and choose Male or Female. Reference curves run from 18 to 85 and differ by about 10 mmHg systolic between the sexes before age 60.
Step 2: Enter your blood pressure reading
Put the top number in the Systolic field and the bottom number in the Diastolic field. Use the average of two seated readings taken a minute apart rather than a single spike.
Step 3: Read your percentile
The green panel shows what percentage of people your age and sex have a lower systolic reading than you. The 50th percentile is the average for your age group.
Step 4: Check the systolic age match
This card names the age your systolic reading would be average for. A 45-year-old reading 138 mmHg is told that number is the average for a 78-year-old man, 33 years ahead of his real age.
Step 5: Compare against the age curve
The chart plots your reading on the population curves. Switch between Men, Women and Both to see where the two curves cross near age 60.
Step 6: Copy the summary
Press Copy summary to place your percentile, age-group average and pulse pressure on the clipboard for a home log or an appointment.
Key Features
- Percentile rank against adults of the same age and sex
- Interactive blood pressure chart by age from 18 to 85
- Separate reference curves for men and women
- Systolic age match — the age your reading is average for
- Pulse pressure compared with the average for your age
- Printable average blood pressure table by age and gender
Understanding Results
Formula
Your percentile is a z-score converted to a probability. The calculator looks up the mean (μ) and standard deviation (σ) of cuff readings for your exact age and sex, interpolating linearly between the anchor ages in its reference table, then computes z = (your reading − μ) ÷ σ and passes it through the standard normal distribution function Φ(z). A 45-year-old man reading 141 mmHg systolic is compared with μ = 126 and σ = 15, giving z = 1.0 and Φ(1.0) = 0.84 — the 84th percentile.
The systolic age match inverts the same curve. Because average systolic pressure increases monotonically with age, every systolic value between the 18-year-old mean and the 85-year-old mean corresponds to exactly one age, and the calculator searches the curve in half-year steps to find it. Pulse pressure is the plain difference, systolic − diastolic, shown next to the average pulse pressure for your age bracket.
Normal Blood Pressure Range by Age
Two different meanings of “normal” are in play, and mixing them is the most common mistake on this topic. The statistical normal is the age-group average: about 120/69 mmHg for men aged 18 to 24, rising to roughly 139/72 mmHg after 75; for women, about 110/66 mmHg rising to about 140/70 mmHg. The clinical normal is fixed by the 2017 ACC/AHA guideline at under 120/80 mmHg, with 130–139 or 80–89 mmHg counting as stage 1 hypertension and 140/90 mmHg or above as stage 2 — at 25 and at 85 alike.
A percentile between the 25th and 75th means you sit in the middle half of your peer group. It does not mean the reading is healthy, because roughly three quarters of US adults over 60 already meet the definition of hypertension and are included in those averages. To classify a single reading by AHA stage rather than by peer comparison, use the blood pressure calculator.
Assumptions & Limitations
The reference curves describe US adults measured by cuff, treated and untreated combined, and follow the NHANES and Framingham pattern of steadily rising systolic pressure with diastolic pressure peaking near age 50 to 55. Percentiles assume a normal distribution around each age-and-sex mean; real systolic distributions carry a right tail, so extreme readings rank a few points higher in reality than the model reports. Population norms also differ by country and ancestry, so treat the percentile as an approximate peer comparison rather than a precise rank.
The curves stop at 18 because children and adolescents are assessed against height-, age- and sex-specific percentiles instead of adult ranges, and they are not validated for pregnancy, where different thresholds apply. Single readings carry substantial noise: an unsupported back adds around 6 mmHg, a full bladder up to 10, and an undersized cuff 2 to 10 mmHg — so enter a three-to-seven-day home average where you can. Any reading of 180/120 mmHg or higher needs prompt medical attention regardless of what percentile it occupies.
Complete Guide: Blood Pressure by Age Calculator
The “normal for my age” trap
Looking up blood pressure by age is usually an attempt to be let off the hook. A 62-year-old reads 138/82, finds a chart showing that the average 62-year-old man runs about 133/79, and concludes the number is close enough to normal to ignore. The comparison is accurate. The conclusion is wrong, and the reason is buried in how those averages are built: population charts describe adults as they actually are, medicated and unmedicated, healthy and hypertensive, all averaged together. Roughly three quarters of US adults over 60 already meet the definition of hypertension. Averaging them into a reference line does not make 138/82 safe — it just tells you how much company you have.
That is the honest use for the calculator above. A percentile answers “how unusual is this?” It never answers “is this healthy?” Those are separate questions with separate evidence behind them, and the rest of this guide is about keeping them apart.
Blood Pressure by Age and Gender: The Reference Chart
Here is the blood pressure chart by age and gender the calculator interpolates from, expressed in ten-year brackets. These are mean cuff readings for US adults, with the standard deviation shown so you can see how much the spread widens with age — a 25-year-old population is tightly clustered, a 75-year-old one is not.
| Age | Men (mmHg) | Women (mmHg) | Systolic spread (±1 SD) | Pulse pressure M / W |
|---|---|---|---|---|
| 18–24 | 120/69 | 110/66 | ±12 | 52 / 44 |
| 25–34 | 122/74 | 112/70 | ±13 | 48 / 42 |
| 35–44 | 124/78 | 116/74 | ±14 | 46 / 42 |
| 45–54 | 128/81 | 123/78 | ±16 | 47 / 45 |
| 55–64 | 132/80 | 130/77 | ±17 | 52 / 53 |
| 65–74 | 136/76 | 136/74 | ±19 | 60 / 62 |
| 75+ | 139/72 | 140/70 | ±20 | 67 / 69 |
Two things in that table matter more than the headline numbers. The systolic spread grows from ±12 mmHg in the youngest bracket to ±20 mmHg in the oldest, which is why a 150 systolic is a genuine outlier at 25 (roughly the 99th percentile) and merely above average at 78 (about the 73rd). And pulse pressure — systolic minus diastolic — falls slightly through the thirties, bottoms out near 46 mmHg, then climbs by more than 20 mmHg over the second half of adult life. That U-shape is the real story of ageing arteries.
Systolic climbs for life. Diastolic peaks at 50 and falls.
Most people assume both numbers drift upward together. They do not. Framingham Heart Study data covering ages 30 to 84 showed systolic pressure rising in a near-straight line across the entire span, while diastolic pressure rose only until roughly age 50 to 60 and then declined for the rest of life. Look at the chart in the calculator: the blue diastolic curve turns over near midlife and heads back down while the emerald systolic curve keeps going.
The mechanism is arterial stiffening. A young aorta is elastic — it balloons out during systole, absorbs part of the ejected stroke volume, then recoils during diastole to keep pressure up between beats. Collagen deposition and elastin fragmentation take that cushioning away. Without the balloon, the systolic peak goes higher and the diastolic trough drops lower. Both numbers move, in opposite directions, for the same reason.
This is why isolated systolic hypertension — a systolic of 140 or more with a diastolic under 90 — accounts for the large majority of hypertension after age 60, and why a falling bottom number in your late sixties is not reassuring. A shift from 150/90 to 155/78 looks like partial improvement on a two-number reading. It is a 17 mmHg widening of pulse pressure, and pulse pressure is itself an independent predictor of cardiovascular events in older adults. If you want that number computed and interpreted directly, the mean arterial pressure calculator reports pulse pressure alongside MAP and flags narrow and wide values.
Why women overtake men after 65
In the 18–24 bracket, women average about 10 mmHg lower systolic than men — 110 against 120. That gap survives through the thirties, narrows sharply across the forties and early fifties, closes near age 60, and then inverts: the two curves are level at 136 systolic in the 65–74 bracket, and past 75 women edge above men. Set the chart above to “Both” and the crossover is visible as an X.
The steepest part of the female curve — roughly 119 to 127 systolic between ages 45 and 55 — coincides with the menopausal transition, when oestrogen’s vasodilatory and renin-angiotensin effects fade. The practical consequence is that a woman comparing herself to “normal blood pressure range” charts she memorised in her thirties will find her reading has climbed 10 to 15 mmHg in a decade without anything obviously changing in her life. That climb is common. It is not benign, and it is the single most under-investigated blood pressure trend in primary care.
Percentile vs. threshold: a worked example
Take two readings that are numerically identical and see how differently they land.
- 135/85 at age 35, male. The age-35 male average is 123/76 with a systolic SD of 13. That puts the systolic at +12 mmHg above average, about the 82nd percentile. The calculator’s systolic age match reports that 135 mmHg is the average for a 68-year-old man — 33 years ahead of his actual age.
- 135/85 at age 72, male. The age-72 male average is 136/75, SD 19. The same systolic is now −1 mmHgbelow average, roughly the 47th percentile — dead centre for his age group.
Percentiles for these two men differ by 35 points. The diagnosis does not differ at all: both are stage 1 hypertension under the 2017 ACC/AHA thresholds, because 130–139 systolic or 80–89 diastolic is stage 1 at every adult age. The 72-year-old is unremarkable among his peers and still meets a treatment-relevant definition — and the 35-year-old, though he shares the same label, is carrying that pressure for an extra 37 years of exposure. Neither number is reassuring; they are unreassuring for different reasons. Run either reading through the blood pressure calculator if you want the stage classification rather than the peer comparison.
What SPRINT proved about treating 75-year-olds
If rising pressure were a harmless feature of ageing, pushing it back down in old age would produce no benefit — or net harm from over-treatment. SPRINT tested exactly that. It randomised 9,361 adults aged 50 and over at elevated cardiovascular risk to a systolic target below 120 mmHg or below 140 mmHg. The trial was stopped early: intensive treatment cut the primary cardiovascular composite by 25% and all-cause mortality by 27%.
The prespecified subgroup of 2,636 participants aged 75 and older is the one that matters here. In that group, treating to below 120 rather than below 140 reduced major cardiovascular events by 34% and all-cause death by 33% — effect sizes at least as large as in the younger participants, including among those classified as frail. Whatever “normal for your age” means, it does not mean the pressure has stopped doing damage.
The dose-response evidence points the same way. A meta-analysis of one million adults across 61 prospective studies found that every 20 mmHg higher systolic (or 10 mmHg higher diastolic) roughly doubles mortality from stroke and ischaemic heart disease, and that this relationship stays log-linear down to 115/75 mmHg, with no threshold below which the association disappears. It holds across the 40–89 age range. There is no age at which the curve flattens out. To see how a specific reading feeds into a multi-factor risk estimate rather than a single-number comparison, the ASCVD risk calculator combines systolic pressure with age, cholesterol, diabetes and smoking status, and the stroke risk calculator weights blood pressure among the strongest single contributors.
Three ways an age comparison misleads
1. Your reading is probably wrong before the comparison even starts. Technique errors are large enough to move you two percentile bands. An unsupported back adds about 6 mmHg; an unsupported or dangling arm adds 6 to 10; crossed legs add 2 to 8; a full bladder adds up to 10; talking during the measurement adds around 10; and a cuff that is too small for the arm overestimates systolic by 2 to 10 mmHg. Stack three of those and you have manufactured 20 mmHg of fictional hypertension. Sit quietly for five minutes, feet flat, back supported, arm at heart level, and take the average of two readings a minute apart.
2. The reference population is medicated. Population means include everyone currently taking antihypertensives, whose readings have already been pulled down by treatment. Untreated averages in the older brackets would run higher, which perversely means the chart understates how much pharmacological help the average 70-year-old is getting to reach 136/76.
3. A single reading is a snapshot of a moving target. Blood pressure follows a circadian rhythm with a morning surge and a nocturnal dip of 10 to 20%, and beat-to-beat variability means two readings five minutes apart can differ by 10 mmHg with nothing wrong. Percentiles calculated from one number inherit all of that noise. Use a three-to-seven-day home average before you take any percentile seriously.
What moves a high percentile down
The 2017 ACC/AHA guideline quantifies each non-drug intervention, which makes it possible to budget a target reduction rather than guess. In adults with hypertension, approximate systolic effects are:
- DASH eating pattern: −11 mmHg. The largest single lever, and the one most people skip.
- Aerobic exercise, 90–150 min/week: −5 to −8 mmHg. Dynamic resistance training gives a similar order of effect.
- Sodium reduction (aim under 1,500 mg/day): −5 to −6 mmHg.
- Potassium 3,500–5,000 mg/day from food: −4 to −5 mmHg. Only if kidney function and medications allow it.
- Weight loss: about −1 mmHg per kilogram lost in people who are overweight.
- Cutting alcohol to ≤2 drinks/day (men) or ≤1 (women): −4 mmHg.
These do not simply add up — combining DASH with sodium restriction produces less than the sum of the two — but stacking three realistic changes plausibly buys 10 to 15 mmHg, which is enough to move a 90th-percentile reading to somewhere near the median for your age. For a broader view of how blood pressure sits alongside cholesterol, weight and family history, the heart disease risk calculator shows what each factor contributes.
One last framing worth carrying away. The right question after using this tool is not “am I normal for my age?” — you now know the answer to that is mostly about who you happen to be standing next to. The question is which direction your own curve has moved over the last three years, and whether you can name one thing on the list above that you have actually changed.
References
- Whelton PK, et al. 2017 ACC/AHA/AAPA/ABC/ACPM/AGS/APhA/ASH/ASPC/NMA/PCNA Guideline for the Prevention, Detection, Evaluation, and Management of High Blood Pressure in Adults. Hypertension, 2018.
- Williamson JD, et al. Intensive vs Standard Blood Pressure Control and Cardiovascular Disease Outcomes in Adults Aged ≥75 Years (SPRINT). JAMA, 2016.
- Franklin SS, et al. Hemodynamic Patterns of Age-Related Changes in Blood Pressure: The Framingham Heart Study. Circulation, 1997.
- Lewington S, et al. Age-specific relevance of usual blood pressure to vascular mortality: a meta-analysis of individual data for one million adults. The Lancet, 2002.
- Centers for Disease Control and Prevention. High Blood Pressure Facts. CDC.

Written by Jurica Šinko
Founder & CEO
Entrepreneur and health information advocate, passionate about making health calculations accessible to everyone through intuitive digital tools.
View full profileFrequently Asked Questions
What is a normal blood pressure range by age?
The average reading climbs from about 120/69 mmHg for men aged 18 to 24 to roughly 139/72 mmHg after 75, and from 110/66 to about 140/70 mmHg for women across the same span. Those are population averages, not health targets. The clinical definition of normal stays fixed at under 120/80 mmHg for every adult age.
Is 140/90 normal for a 70 year old?
It is common at 70 but it is not normal in the clinical sense. A systolic of 140 sits at about the 58th percentile for 70-year-old men, so more than 40 percent of that age group reads higher. Under the 2017 ACC/AHA guideline 140/90 mmHg is stage 2 hypertension at every adult age, and it usually warrants medication alongside lifestyle changes.
Does blood pressure naturally increase with age?
Systolic pressure rises with age in almost every industrialised population, but that reflects arterial stiffening and cumulative diet and weight exposure rather than an unavoidable biological rule. Isolated hunter-gatherer and Yanomami populations show almost no age-related rise. Rising pressure is common, predictable, and still harmful.
What is a good blood pressure range for a woman over 60?
The average 60-year-old woman reads about 130/77 mmHg and the average 70-year-old about 136/74 mmHg, but a good reading is under 120/80 mmHg regardless of age. Women climb steeply between 45 and 55, gaining roughly 8 mmHg systolic across the menopausal transition, then overtake men at around age 65.
Why is my bottom number going down as I get older?
Diastolic pressure peaks near age 50 to 55 and then falls for the rest of life because stiffened arteries no longer recoil between beats to hold pressure up. A shift from 150/90 to 155/78 is not improvement; it is a 17 mmHg widening of pulse pressure. This pattern, called isolated systolic hypertension, accounts for most hypertension after age 60.
Is 120/80 still the target if I am 80 years old?
The evidence says lower targets keep paying off in old age. In the SPRINT trial, the 2,636 participants aged 75 and over who were treated to a systolic below 120 rather than below 140 had 34 percent fewer major cardiovascular events and 33 percent lower all-cause mortality. Targets in the very frail are individualised, so this is a conversation to have with your clinician rather than a self-set goal.
What blood pressure is too high for my age?
The thresholds do not shift with age: 130 to 139 systolic or 80 to 89 diastolic is stage 1 hypertension, 140/90 mmHg or above is stage 2, and 180/120 mmHg or above needs same-day medical attention. What age changes is how unusual you are. A systolic of 150 is roughly the 99th percentile at 25 and about the 73rd percentile at 78.
How is a blood pressure percentile calculated?
The calculator takes the mean and standard deviation of cuff readings for your age and sex, then finds where your number falls on that distribution. At age 45 the male mean is 126 mmHg with a standard deviation of 15, so a reading of 141 sits one standard deviation high, at about the 84th percentile. Real systolic distributions are right-skewed, so very high readings rank slightly higher in reality than this normal-curve model shows.
Related Calculators

A1C Calculator — Convert HbA1c to eAG with Targets
Use our A1C calculator to convert HbA1c to estimated average glucose (eAG). See normal, prediabetes, and diabetes thresholds in mg/dL and mmol/L. Fast results.

Albumin Calculator — Serum Albumin Level Interpretation
Free albumin calculator to interpret serum albumin levels, grade hypoalbuminemia, and compute A/G ratio plus albumin-corrected calcium from your lab results.
Albumin-Corrected Anion Gap Calculator — Hidden Acidosis
Use our albumin-corrected anion gap calculator to raise the anion gap by 2.5 per 1 g/dL of low albumin and reveal a hidden high-gap metabolic acidosis.

ANC Calculator: Absolute Neutrophil Count & Neutropenia
Free ANC calculator to calculate absolute neutrophil count from WBC and differential. Get ANC in cells/uL and x10^9/L with instant neutropenia grading.
Anion Gap Calculator — Metabolic Acidosis Evaluation
Free anion gap calculator finds serum anion gap from sodium, chloride, and bicarbonate, with albumin correction and delta ratio for metabolic acidosis.

AST/ALT Ratio Calculator — Free De Ritis Ratio Tool
Use our free AST/ALT ratio calculator to compute the De Ritis index instantly. Visual ratio chart, enzyme-level assessment, and clinical patterns guide.