Use the Glycemic Load Calculator
Free glycemic load calculator that turns any food and portion into its GL, using GI and available carbs, with low, medium, and high bands plus a day total.
Choose a food and portion
Typical serving: 1 cup diced (120 g).
Glycemic Load per serving
Watermelon
High GI, but low glycemic load
Watermelon rates GI 76, yet this portion carries only 8.6 g of available carbohydrate — so the actual glucose load is 6.6. The index describes carbohydrate quality; the load describes how much of it you are eating.
Glycemic Index
76
High GI
Available Carbs
8.6 g
drives the load
Total Carbs
9.1 g
before fibre
Fibre Removed
0.5 g
not absorbed as glucose
A GL of 6.6 means this serving raises blood glucose about as much as 6.6 g of pure glucose.
Your day so far
Add foods above to build a daily total. Most adults land near 100 GL a day; under 80 counts as a low-GL diet.
Common foods ranked by glycemic index
Sorted highest GI first. Notice how often the GL column disagrees with the ranking.
| Food | Serving | GI | Avail. carbs | GL |
|---|---|---|---|---|
| Potato, baked | 1 medium (150 g) | 85 | 28.2 g | 24 |
| Cornflakes | 1 cup (30 g) | 81 | 24.3 g | 19.7 |
| Watermelon | 1 cup diced (120 g) | 76 | 8.6 g | 6.6 |
| Glazed doughnut | 1 doughnut (47 g) | 76 | 23.3 g | 17.7 |
| White bread | 1 slice (30 g) | 75 | 13.9 g | 10.4 |
| White rice, boiled | 1 cup cooked (150 g) | 73 | 41.4 g | 30.2 |
| Banana, ripe | 1 medium (120 g) | 51 | 24.5 g | 12.5 |
| Basmati rice, boiled | 1 cup cooked (150 g) | 50 | 36.5 g | 18.2 |
| Carrots, boiled | 1/2 cup (80 g) | 39 | 4 g | 1.6 |
| Apple | 1 small (120 g) | 36 | 13.9 g | 5 |
| Lentils, boiled | 3/4 cup (150 g) | 32 | 18.2 g | 5.8 |
| Chickpeas, boiled | 3/4 cup (150 g) | 28 | 29.1 g | 8.1 |
Note: Published GI values are population averages measured in small groups, and individual glucose responses to the same food vary by roughly 25%. Cooking time, ripeness, food processing, and what else is on the plate all shift the real response. This tool is for education, not for insulin dosing or diabetes treatment decisions — talk to your clinician or a registered dietitian for those.
Educational tool, not medical advice. Check this tool’s method and limitations before interpreting a result. Talk to a qualified healthcare professional before making decisions about medication, diet, exercise, or treatment. See our Terms of Use.
Your rating helps improve Glycemic Load Calculator. We store only an anonymized vote (no personal data).
How to Use Glycemic Load Calculator
Step 1: Pick a food
Leave the mode set to "Pick a food" and narrow the list with a category pill such as Fruit or Legumes. Choose an item from the Food dropdown, which shows each food with its published glycemic index.
Step 2: Set the portion you will actually eat
Type the weight into the Portion (grams) field. Glycemic load scales directly with portion, so 300 g of rice carries twice the load of 150 g. Tap "Use it" to snap back to the typical published serving.
Step 3: Read the glycemic load
Your GL appears immediately with a marker on the 0 to 30 scale. A value of 10 or under is low, 11 to 19 is medium, and 20 or above is high for a single serving.
Step 4: Check whether GI and GL disagree
When the food rates in one band for glycemic index and a different band for glycemic load, a blue callout explains the gap. Watermelon at GI 76 with a GL near 7 is the classic case.
Step 5: Build a daily total
Press "Add to my day" to stack foods into a running total. A whole day under 80 counts as a low glycemic load diet, 80 to 120 is typical, and over 120 is high.
Step 6: Enter a food that is not listed
Switch to "Enter my own" and copy the glycemic index, total carbohydrate, and fibre straight off the nutrition label. Sugar alcohols are optional and only apply to labels that declare them.
Key Features
- 41-food database with published GI, carbohydrate, and fibre values
- Live portion scaling in grams — the load updates as the serving changes
- Flags foods where the GI band and the GL band disagree
- Running daily glycemic load total with low, medium, and high bands
- Custom mode for any nutrition label, including fibre and sugar alcohols
Understanding Results
Formula
Glycemic load multiplies a food's glycemic index by the carbohydrate your body can actually absorb from the portion in front of you, then divides by 100 to put the answer back on a glucose scale:
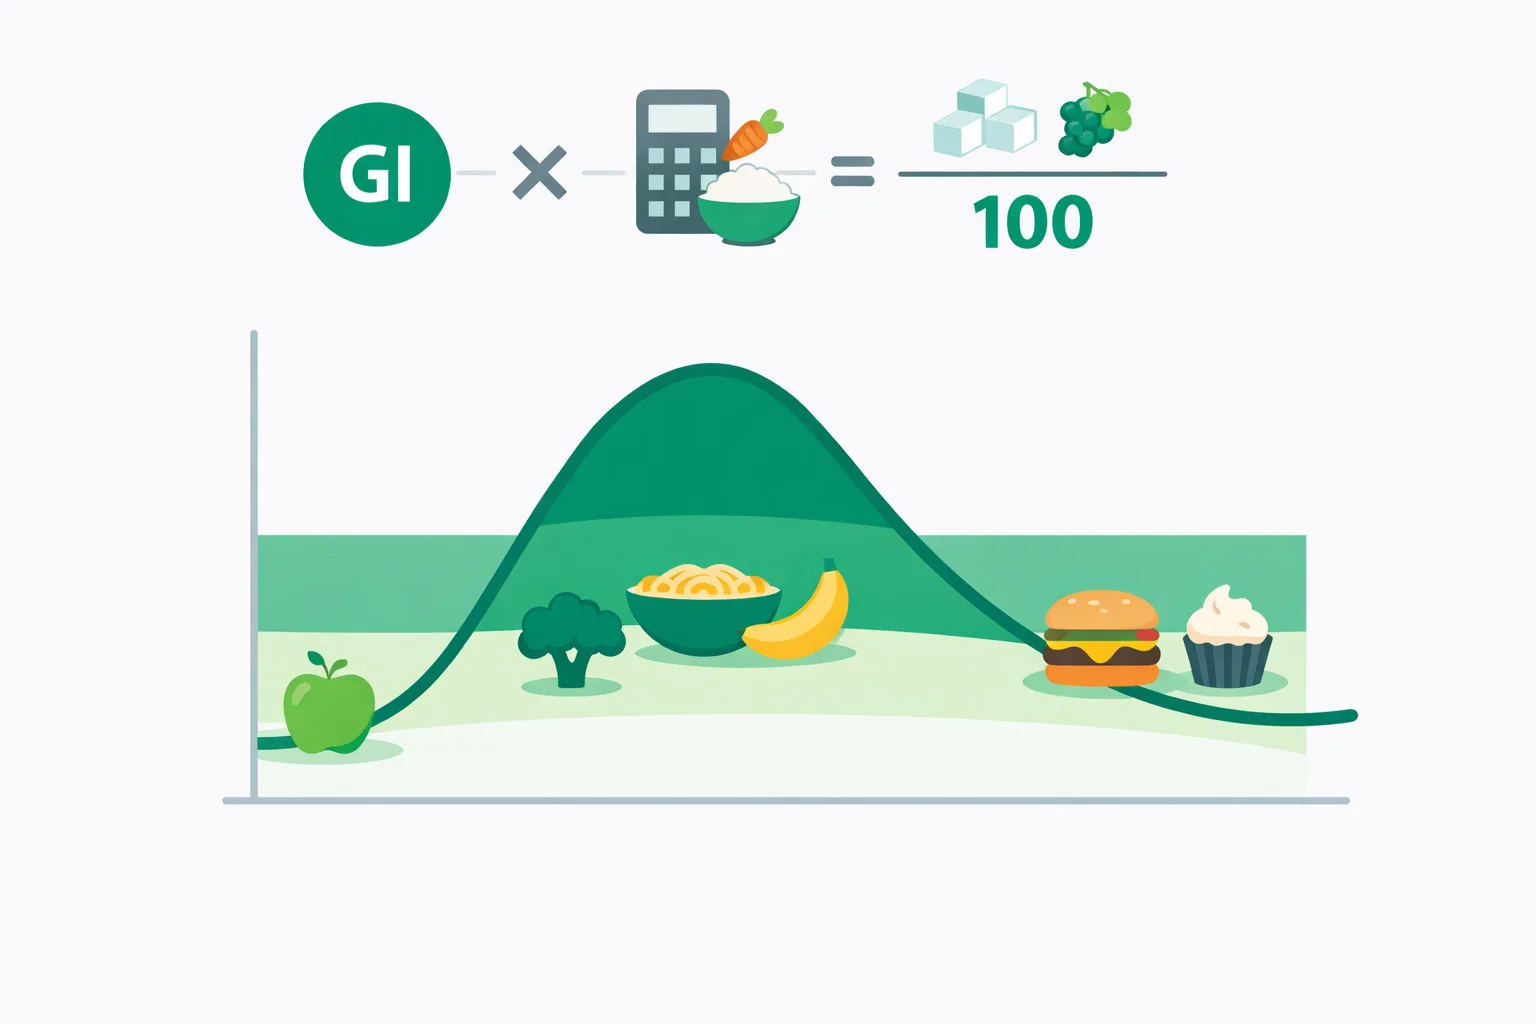
GL = (GI × available carbohydrate in grams) ÷ 100
GI is the glycemic index on the glucose = 100 scale. Available carbohydrate is total carbohydrate minus dietary fibre for your actual serving, because fibre is not digested into glucose. The result is expressed in grams of glucose equivalent, so a GL of 12 raises blood sugar about as much as 12 g of pure glucose.
Worked through with one cup of boiled white rice at 150 g: GI 73, 42 g total carbohydrate, 0.6 g fibre. That leaves 41.4 g available, so GL = (73 × 41.4) ÷ 100 = 30.2. Because only the carbohydrate term changes with portion size, halving the rice to 75 g halves the load to 15.1 while the GI stays fixed at 73.
Reference Ranges & Interpretation
Two separate scales apply, and mixing them up is the most common error. Per serving, the cut-offs published by Brand-Miller and colleagues are:
| Band | Per serving (GL) | Whole day (GL) | Glycemic index |
|---|---|---|---|
| Low | 10 or under | Under 80 | 55 or under |
| Medium | 11 to 19 | 80 to 120 | 56 to 69 |
| High | 20 or above | Above 120 | 70 or above |
A food can sit in different bands on the GI and GL columns, and that gap is informative rather than contradictory. Boiled carrots score GI 39 and GL 2 — low on both. Watermelon scores GI 76 and GL 7, high on one and low on the other, because a cup contains so little carbohydrate. Basmati rice inverts it: GI 50 but GL 18, since 36.5 g of available carbohydrate per cup outweighs the gentle index.
Assumptions & Limitations
The calculator assumes the published GI for a food applies to your portion and your metabolism. Several things break that assumption:
- Individual response varies about 25%. Continuous glucose monitor studies of 800 adults found people can respond very differently to the same standardised meal, so treat GL as a planning estimate rather than a prediction of your own curve.
- Preparation shifts the index. Al dente pasta tests near GI 49 and overcooked pasta above 60. Cooking and then chilling potatoes or rice builds resistant starch that can cut the effective load by up to a quarter. Ripeness matters too: a green banana sits near GI 30, a speckled one near 51.
- Mixed meals blunt the peak. Fat, protein, acid, and fibre eaten alongside carbohydrate slow gastric emptying, so a GL calculated food by food overstates the response from a composed plate.
- Sugar alcohols are not fully subtractable. The optional polyol field follows US label convention, but maltitol has a GI near 35 and does raise glucose, unlike near-zero erythritol.
This tool is educational. It is not a basis for insulin dosing, medication timing, or any diabetes treatment decision — those belong with your clinician or a registered dietitian, guided by your own glucose readings.
Complete Guide: Glycemic Load Calculator
On this page
- Glycemic index vs. glycemic load: which one should you use?
- The formula, worked twice
- Where the two rankings openly disagree
- Double the rice, double the load
- Why fibre gets subtracted (and sugar alcohols are murkier)
- What counts as a low-GL day?
- Four things that break a glycemic load calculator estimate
- References
Use a glycemic load calculator and you quickly hit a result that feels wrong: watermelon and a glazed doughnut have almost the same glycemic index — both sit at 76 on the glucose scale. Diabetes advice built on GI charts alone would flag them equally. Yet a 120 g cup of watermelon has a glycemic load of about 7, while one 47 g doughnut lands near 18. The doughnut hits your bloodstream roughly two and a half times harder. Neither number is wrong; they simply measure different things, and knowing which one to read is the whole point of this guide.
Glycemic Index vs. Glycemic Load: Which One Should You Use?
Glycemic index answers a laboratory question: if I feed you exactly 50 g of available carbohydrate from this food, how high does your blood glucose climb over two hours compared with 50 g of pure glucose? That fixed 50 g is the catch. To get 50 g of carbohydrate from watermelon you would have to eat roughly 700 g of it — about five cups. GI describes carbohydrate quality under conditions almost nobody eats in.
Glycemic load fixes that by folding in the portion actually on your plate. Harvard researchers introduced it in 1997 precisely because GI kept mislabelling low-carbohydrate, high-water foods like carrots and melon as dangerous. GL is expressed in grams of glucose equivalent: a GL of 12 means that serving nudges blood sugar about as much as swallowing 12 g of straight glucose. That makes GL additive, so you can total a meal or a whole day — something you can never do with GI.
The Formula, Worked Twice
The equation is short enough to do on a napkin:
GL = (GI × available carbohydrate in grams) ÷ 100
Available carbohydrate = total carbohydrate − dietary fibre, measured for the portion you are actually eating — not per 100 g, and not per the 50 g GI test dose.
Worked example 1 — one cup of boiled white rice (150 g). White rice tests at GI 73 and carries 28 g of carbohydrate and 0.4 g of fibre per 100 g. Scale to 150 g: 42 g total carbohydrate minus 0.6 g fibre gives 41.4 g available. So GL = (73 × 41.4) ÷ 100 = 30.2. That is a high GL — one of the highest single servings in normal rotation.
Worked example 2 — one cup of boiled lentils (150 g). Lentils test at GI 32 with 20 g carbohydrate and 7.9 g fibre per 100 g. At 150 g that is 30 g total carbohydrate minus 11.9 g fibre = 18.1 g available. GL = (32 × 18.1) ÷ 100 = 5.8. Same portion weight, same food group slot on the plate, and the rice delivers over five times the glucose load. If you are tracking totals rather than swaps, our carb calculator sets the daily carbohydrate target this load sits inside.
Where the Two Rankings Openly Disagree
Sort common foods by GI and then by GL and the order scrambles. These are the reversals worth memorising, because they are where GI-only advice sends people wrong:
| Food (typical serving) | GI | GL | What the gap tells you |
|---|---|---|---|
| Watermelon, 120 g | 76 (high) | 7 (low) | 92% water — a cup holds only 8.6 g of carbohydrate |
| Carrots, boiled, 80 g | 39 (low) | 2 (low) | The 1980s "carrots are sugar" scare came from an early GI misread |
| Basmati rice, 150 g | 50 (low) | 18 (medium) | Low GI, but 36.5 g of carbohydrate per cup drags the load up |
| Dates, dried, 60 g | 42 (low) | 17 (medium) | Dehydration concentrates carbohydrate to 75 g per 100 g |
| Popcorn, plain, 20 g | 65 (medium) | 8 (low) | Air makes the portion huge and the carbohydrate small |
| White rice, boiled, 150 g | 73 (high) | 30 (high) | Both metrics agree — the genuinely heavy option |
Two patterns fall out. Watery and airy foods (melon, carrots, popcorn) look worse on GI than they deserve. Dense, dry, low-GI foods (dates, basmati, wholemeal pasta in a big bowl) look better on GI than they deserve. Anything that concentrates carbohydrate by removing water — drying, juicing, milling — pushes GL up while leaving GI roughly where it was.
Double the Rice, Double the Load
Here is the property that makes GL genuinely useful and that no GI chart can show you: GL scales linearly with portion while GI never moves at all. Run the same white rice through four portion sizes:
| Portion of boiled white rice | GI | Available carbs | GL |
|---|---|---|---|
| 75 g (half cup) | 73 | 20.7 g | 15 |
| 150 g (one cup) | 73 | 41.4 g | 30 |
| 225 g (one and a half cups) | 73 | 62.1 g | 45 |
| 300 g (restaurant plate) | 73 | 82.8 g | 60 |
The GI column is frozen at 73 down the whole table, which is exactly why GI alone cannot help you make a portion decision. Meanwhile that last row — a single restaurant rice serving — carries a GL of 60, roughly three quarters of an entire low-GL day in one side dish. Halving the rice and filling the gap with vegetables cuts 30 GL without touching a single "bad" food. In practice that swap moves the needle more than any low-GI substitution most people attempt.
Why Fibre Gets Subtracted (and Sugar Alcohols Are Murkier)
Dietary fibre comes off the top because humans lack the enzymes to break its bonds into glucose. It reaches the colon largely intact, so it contributes nothing to the blood glucose curve the GI test measured. That single subtraction is why lentils at 7.9 g fibre per 100 g score a GL of 5.8 while white rice at 0.4 g fibre scores 30.2 — roughly a third of the lentils' carbohydrate never becomes available glucose.
Sugar alcohols are a different story, and the calculator treats them as optional for good reason. US labelling convention lets manufacturers subtract polyols in full to advertise "net carbs", but the research standard behind published GI values does not. Maltitol, the most common polyol in sugar-free chocolate, has a GI around 35 and does raise blood glucose measurably; erythritol is close to zero. Subtracting all of them equally understates the load of maltitol-sweetened products. If you follow a ketogenic pattern where this arithmetic decides your day, the keto macro calculator handles those ratios directly.
What Counts as a Low-GL Day?
Per serving, the accepted cut-offs are 10 or under for low, 11 to 19 for medium, and 20 or above for high. Across a full day, a total under 80 is considered a low-GL diet, 80 to 120 is typical of a Western pattern, and above 120 is high. Those daily numbers matter more than any single food: the large prospective cohorts linking glycemic load to type 2 diabetes and cardiovascular risk measured daily totals, not individual servings.
A worked day makes the budget concrete. Steel-cut oats (250 g, GL 12) plus an apple (GL 5) at breakfast, a lentil and vegetable bowl at lunch (GL 6), an orange mid-afternoon (GL 4), and salmon with 150 g of basmati and greens for dinner (GL 18) totals 45 — comfortably low, with room left over. Swap the basmati for 300 g of white rice and that same day jumps to 87. One decision, 42 points. If you are tracking how those totals move your actual readings, pair this with the blood sugar calculator for interpreting fasting and post-meal glucose values.
Four Things That Break a Glycemic Load Calculator Estimate
Glycemic load is a good estimate, not a measurement of your own physiology. Four factors move real responses well away from the table value:
- Individual variation. Weizmann Institute researchers tracked 800 people with continuous glucose monitors and found responses to identical meals varied so widely that some participants spiked on tomatoes while others did not react to white bread. Published GI values are group means with standard deviations around 25%.
- Cooking and cooling. Pasta boiled to al dente tests near GI 49; the same pasta cooked 20 minutes climbs past 60. Cooking and then chilling potatoes or rice forms resistant starch that behaves like fibre, cutting the effective load by up to 25%.
- Ripeness and processing. An underripe banana sits near GI 30; fully speckled it reaches 51 as starch converts to sugar. Grinding grain finer raises GI even with identical ingredients — stoneground wholemeal bread beats fine-milled wholemeal.
- What else is on the plate. Fat, protein, acid, and fibre eaten alongside carbohydrate slow gastric emptying. Adding vinegar to a high-GI meal has been shown to reduce the glucose peak by roughly 30%, and eating vegetables and protein before the starch flattens the curve further.
None of this makes GL useless — it makes it a planning tool rather than a prediction. Use it to compare options and size portions, then let your own glucose readings settle the individual questions. For a broader look at how a specific food fits the rest of your intake, the food nutrition calculator breaks down the full macro and micronutrient profile alongside the carbohydrate figure.
References
- Atkinson FS, Brand-Miller JC, Foster-Powell K, et al. International tables of glycemic index and glycemic load values 2021: a systematic review. The American Journal of Clinical Nutrition, 2021.
- Salmerón J, Manson JE, Stampfer MJ, et al. Dietary fiber, glycemic load, and risk of non-insulin-dependent diabetes mellitus in women. JAMA, 1997 — the paper that introduced glycemic load.
- Zeevi D, Korem T, Zmora N, et al. Personalized nutrition by prediction of glycemic responses. Cell, 2015.
- US Department of Agriculture. FoodData Central — carbohydrate and dietary fibre values used in this calculator.

Written by Jurica Šinko
Founder & CEO
Entrepreneur and health information advocate, passionate about making health calculations accessible to everyone through intuitive digital tools.
View full profileFrequently Asked Questions
What is the difference between glycemic index and glycemic load?
Glycemic index rates carbohydrate quality using a fixed 50 g test dose, while glycemic load multiplies that rating by the carbohydrate actually in your portion. GI ignores serving size entirely, which is why watermelon rates a high GI of 76 but a low GL of about 7 in a 120 g cup. Use GI to compare two foods gram for gram, and GL to judge the meal in front of you.
What is a good glycemic load per meal?
A single serving at 10 or under is low, 11 to 19 is medium, and 20 or above is high. Most balanced meals land between 15 and 25 once you count every carbohydrate source on the plate. A 300 g restaurant portion of white rice alone reaches 60, which is why portion size usually matters more than food choice.
How do I calculate glycemic load from a nutrition label?
Subtract the fibre grams from the total carbohydrate grams for one serving, multiply by the food glycemic index, then divide by 100. A cereal bar with 30 g carbohydrate, 4 g fibre, and a GI of 55 works out to 26 times 55 divided by 100, or a GL of 14.3. Labels do not print GI, so look it up in the International Tables of Glycemic Index.
Is watermelon bad for diabetics if its glycemic index is 76?
No. Watermelon is 92% water, so a 120 g cup holds only about 8.6 g of available carbohydrate and produces a glycemic load near 7, which sits in the low band. The high GI reflects how fast that small amount of sugar is absorbed, not how much arrives. Eating four cups in one sitting would push the load past 25 and change the answer.
Do you subtract fiber when calculating glycemic load?
Yes. Glycemic load uses available carbohydrate, which is total carbohydrate minus dietary fibre, because humans cannot digest fibre into glucose. The subtraction matters most for legumes: lentils carry 7.9 g fibre per 100 g, which drops a 150 g serving from 30 g total carbohydrate to 18.1 g available and lands the GL at 5.8 instead of 9.6.
What is a low glycemic load for a whole day?
A daily total under 80 is considered a low glycemic load diet, 80 to 120 is typical of a Western eating pattern, and above 120 is high. The large cohort studies linking glycemic load to type 2 diabetes and heart disease risk measured these daily totals rather than single foods, so the day-level number is the one worth tracking.
Why is basmati rice low GI but still a high glycemic load?
Basmati tests at GI 50, comfortably in the low band, but a 150 g cooked cup delivers about 36.5 g of available carbohydrate. That gives a GL near 18, right at the top of the medium range. Any dense, dry, starchy food can be low GI and still carry a heavy load once the portion is realistic.
Does cooking pasta longer change its glycemic load?
Yes, because overcooking raises the glycemic index. Pasta boiled al dente tests near GI 49, while the same pasta cooked about 20 minutes climbs past 60, lifting the load roughly 20% at an identical portion. Cooking then chilling starchy foods works the other way: the resistant starch that forms can cut the effective load by up to 25%.
Related Calculators

BMR Calculator: Basal Metabolic Rate by Proven Formulas
Use our BMR calculator to estimate your basal metabolic rate using Mifflin–St Jeor or revised Harris–Benedict formulas. Choose metric or US units and see TDEE.
Caffeine Content Calculator — Coffee, Energy Drinks & Tea
Free caffeine content calculator showing how much caffeine is in coffee, espresso, tea, Red Bull, Monster and Celsius, plus your safe daily limit by weight.
Caffeine Half-Life Calculator: How Long Caffeine Lasts
Free caffeine half-life calculator showing how much caffeine is left at bedtime, your personal clearance rate, and the latest safe cutoff time to drink.

Calorie Calculator: Daily TDEE and Intake Estimate
Use our calorie calculator to estimate daily energy needs (TDEE) from age, sex, height, weight, and activity. See maintain, loss, and gain targets instantly.
Calorie Deficit Calculator — Set a Safe Daily Deficit
Use our calorie deficit calculator to set a safe daily calorie target. Estimate TDEE, choose a weekly weight-loss rate, and see deficit, timeline, and guidance.
Calorie Density Calculator: Calories per Gram of Food
Free calorie density calculator that turns calories and grams into kcal per gram, sorts any food into four energy density bands, and compares two foods.