Use the Gentamicin Calculator
Free gentamicin calculator for extended-interval and traditional dosing. Get the mg dose, interval, predicted peak and trough, and the Cmax to MIC ratio.
Dosing strategy
Adults only — not validated for neonates or children.
Use a stable value — a rising creatinine invalidates the interval.
Scale weight — converted to the correct dosing weight below.
Required — gentamicin is dosed on lean mass, not scale weight.
Regimen detail
Gentamicin dose
490mg
every 24 hours · 490 mg/day · infuse over 30 min
Predicted concentration across one 24-hour interval
peak 25.3 → trough 0.08 mg/LThe level stays under 1 mg/L for roughly 10.2 hours of this interval. That drug-free window lets proximal tubular cells release accumulated gentamicin, and it is the entire mechanism behind once-daily dosing.
Estimated peak (Cmax, end of infusion)
25.3mg/LEstimated trough (Cmin, before the next dose)
0.08mg/LCmax/MIC ratio at MIC 1 mg/L (target 10 or above)
25.3CrCl (Cockcroft-Gault)
78.3 mL/min
Vd (0.26 L/kg)
18.3 L
Half-life
2.8 h
AUC₂₄
110 mg·h/L
Extended-interval nomogram by creatinine clearance
Peak 15–30 mg/L, trough under 1 mg/L (ideally undetectable). Gentamicin reaches steady state in about four half-lives (11 h here), so draw a level after the first or second dose rather than waiting.
Peak and trough targets by indication
| Indication | Regimen | Peak | Trough |
|---|---|---|---|
| Serious gram-negative sepsis | 5–7 mg/kg q24h | 15–30 mg/L | under 1 mg/L |
| Pneumonia, complicated intra-abdominal | 1.7–2 mg/kg q8h | 6–10 mg/L | under 2 mg/L |
| Uncomplicated urinary tract infection | 1–1.5 mg/kg q8h | 4–6 mg/L | under 1 mg/L |
| Enterococcal / streptococcal endocarditis | 1 mg/kg q8h | 3–4 mg/L | under 1 mg/L |
Clinical disclaimer
This gentamicin calculator produces population-based empiric estimates for adults with stable renal function. Predicted peak, trough, and AUC come from a one-compartment model and can differ from measured concentrations by 30% or more in sepsis, burns, ascites, cystic fibrosis, and pregnancy, where volume of distribution shifts substantially. It does not apply to neonates, children, hemodialysis, or continuous renal replacement therapy. Confirm every regimen against measured serum levels and your institutional aminoglycoside protocol before administration.
Educational tool, not medical advice. Check this tool’s method and limitations before interpreting a result. Talk to a qualified healthcare professional before making decisions about medication, diet, exercise, or treatment. See our Terms of Use.
Your rating helps improve Gentamicin Calculator. We store only an anonymized vote (no personal data).
How to Use Gentamicin Calculator
Step 1: Choose the dosing strategy
Select Extended-interval for serious gram-negative infection, Traditional for divided q8h dosing, or Synergy for enterococcal and streptococcal endocarditis. The peak and trough targets change with each choice.
Step 2: Enter sex, age, weight, and height
Enter biological sex, age in years, total body weight in kg or lb, and height in cm or in. Height is required because gentamicin is dosed on lean mass, so the calculator converts scale weight to ideal or adjusted body weight automatically.
Step 3: Enter serum creatinine
Type a stable serum creatinine in mg/dL or switch the toggle to µmol/L. This drives the Cockcroft-Gault creatinine clearance that sets the dosing interval, so avoid a value drawn while creatinine is still rising.
Step 4: Set the regimen detail
Pick the mg/kg dose, leave the interval on Auto to follow the nomogram or override it, choose an infusion time of 30 to 120 minutes, and set the organism MIC reported by your laboratory.
Step 5: Read the dose and predicted levels
The calculator returns the rounded dose in mg with its interval, the predicted peak and trough against target bands, the Cmax to MIC ratio, AUC over 24 hours, half-life, and a concentration-time curve for one interval.
Step 6: Confirm against a measured level
Use Copy summary to move the regimen into your notes, then verify it with a measured serum concentration. Predicted values are population estimates and are not a substitute for therapeutic drug monitoring.
Key Features
- Extended-interval, traditional q8h, and endocarditis synergy regimens side by side
- Automatic dosing weight — actual, ideal, or adjusted once scale weight passes 1.2 × IBW
- Interval nomogram driven by Cockcroft-Gault creatinine clearance (q24h to q48h)
- Predicted peak, trough, and AUC₂₄ from a Sawchuk-Zaske intermittent-infusion model
- Cmax/MIC ratio scored against the concentration-dependent killing target of 10
- Concentration-time curve showing how many hours stay below 1 mg/L
Understanding Results
Formula
The gentamicin dose is the milligram-per-kilogram figure multiplied by the dosing weight, then rounded to the nearest 10 mg vial increment. Dosing weight is chosen from Devine ideal body weight (IBW): actual weight if it is below IBW, IBW if scale weight sits between IBW and 1.2 × IBW, and adjusted body weight of IBW + 0.4 × (actual − IBW) at or above that threshold. That same weight feeds Cockcroft-Gault, which sets the interval.
IBW (kg): 50 (male) or 45.5 (female) + 2.3 × (height in inches − 60)
CrCl (mL/min): [(140 − age) × dosing weight] ÷ (72 × SCr mg/dL) × 0.85 if female
Vd (L): 0.26 × dosing weight · kₑ (h⁻¹): 0.00293 × CrCl + 0.014
Peak: (Dose ÷ tₓ ÷ CL) × (1 − e^−kₑtₓ) ÷ (1 − e^−kₑτ)
Trough: Peak × e^−kₑ(τ − tₓ) · AUC₂₄: daily dose ÷ clearance
Here tₓ is the infusion duration in hours, τ is the dosing interval, and CL is clearance (kₑ × Vd). The elimination rate constant comes from the Hull-Sarubbi relationship, and the peak and trough equations are the standard Sawchuk-Zaske steady-state intermittent-infusion model. The Cmax/MIC ratio is simply the predicted peak divided by the organism's minimum inhibitory concentration.
Reference Ranges & Interpretation
Targets are set by the regimen, not by the drug. Extended-interval dosing deliberately produces a peak two to three times higher than traditional dosing and a trough that should be undetectable.
- Extended-interval (5–7 mg/kg): peak 15–30 mg/L, trough under 1 mg/L. Intervals of 24 h above 60 mL/min CrCl, 36 h at 40–59, and 48 h at 20–39.
- Traditional (1.7–2 mg/kg q8h): peak 6–10 mg/L, trough under 2 mg/L for pneumonia and complicated intra-abdominal infection; 4–6 mg/L peak is adequate for uncomplicated urinary sources.
- Synergy (1 mg/kg q8h): peak 3–4 mg/L, trough under 1 mg/L for enterococcal and streptococcal endocarditis alongside a cell-wall active agent.
- Cmax/MIC: 10 or above predicts clinical response and suppresses adaptive resistance; below 8 is subtherapeutic regardless of how the peak looks in isolation.
- AUC₂₄: roughly 70–120 mg·h/L. Above 120 the nephrotoxicity signal rises, and the fix is a longer interval rather than a smaller dose.
- Half-life: 2–3 hours with normal renal function, lengthening to 30–60 hours in anuria. Steady state arrives after about four half-lives.
Assumptions & Limitations
Every predicted concentration on this page comes from a one-compartment population model with a fixed volume of distribution of 0.26 L/kg. That assumption holds reasonably in stable adults and breaks in the situations where aminoglycosides are most often prescribed.
- Septic shock, burns over 20% of body surface, ascites, and pregnancy expand volume of distribution toward 0.4 L/kg, so real peaks run 20–35% below the predicted value.
- Cockcroft-Gault assumes a stable serum creatinine. During evolving acute kidney injury, creatinine lags true filtration by 24–48 hours and the calculated interval will be too short.
- Neonates, children, hemodialysis, and continuous renal replacement therapy fall outside this model entirely and require dedicated protocols.
- Rounding to the nearest 10 mg shifts the predicted peak by up to roughly 2%, which is immaterial next to the 30% inter-patient variability in clearance.
- The calculator does not account for concurrent nephrotoxins. Vancomycin, loop diuretics, amphotericin B, NSAIDs, IV contrast, and calcineurin inhibitors all raise acute kidney injury risk and shift monitoring toward measured levels and daily creatinine.
Treat the output as an empiric starting point that must be confirmed with therapeutic drug monitoring. Keep courses short — nephrotoxicity and largely irreversible vestibular toxicity both climb sharply beyond seven days — and follow your institutional aminoglycoside protocol, which supersedes any general nomogram.
Complete Guide: Gentamicin Calculator
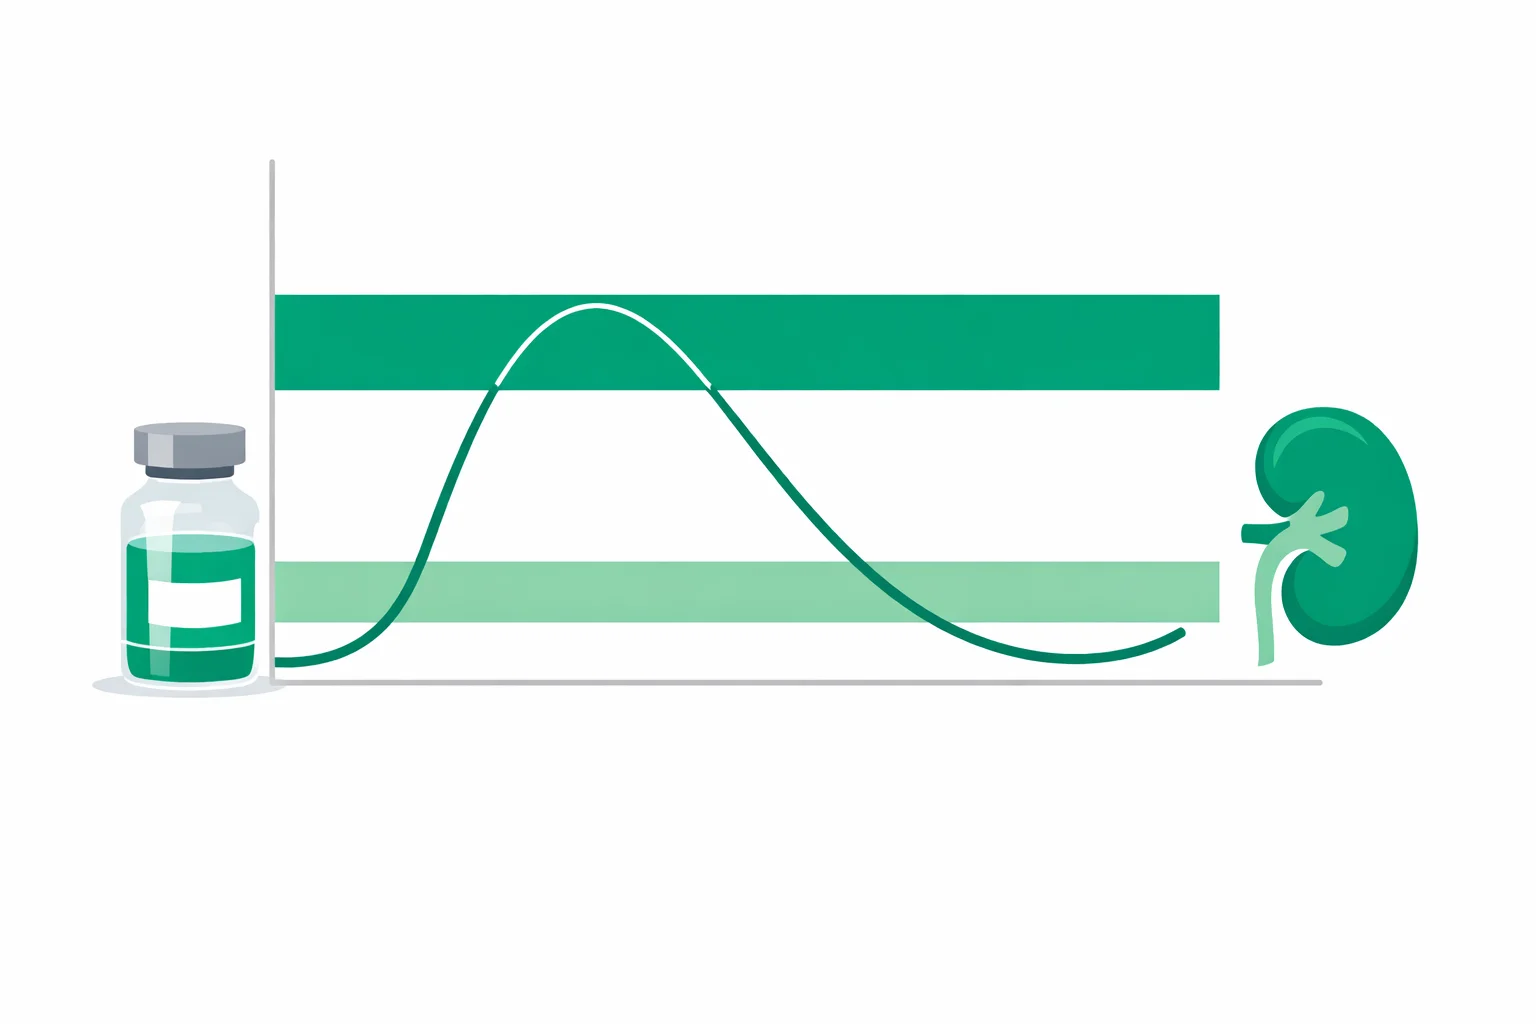
On this page
Most people reach for a gentamicin calculator believing the goal is a safe trough, and that belief quietly causes more harm than the drug does. A trough of 0.4 mg/L on a once-daily regimen looks alarming to anyone trained on the old q8h targets — it reads as if the patient spent most of the day with no antibiotic on board. That is precisely correct, and it is precisely the point. Gentamicin kills in proportion to how high its peak climbs, and it poisons kidneys in proportion to how long its concentration lingers. Those two facts pull dosing in opposite directions, and every design decision in aminoglycoside therapy is a negotiation between them.
The gentamicin dosing calculator above builds a full regimen — dose in milligrams, interval in hours, predicted peak, predicted trough, and the Cmax/MIC ratio — from age, sex, height, scale weight, and serum creatinine. This guide explains the reasoning underneath: why the dosing weight is almost never the number on the scale, how the interval nomogram is derived, and which of the three common regimens fits the infection in front of you.
Why a gentamicin calculator should not chase a safe trough
Gentamicin enters proximal renal tubular cells through megalin and cubilin receptors on the brush border. That transport pathway is saturable. Once the receptors are occupied, raising the serum concentration further adds almost nothing to intracellular accumulation — but keeping the serum concentration elevated for hours keeps feeding the pathway continuously. The same saturable uptake happens in cochlear and vestibular hair cells, which is why aminoglycoside ototoxicity follows the same exposure logic.
Read that mechanism carefully and the classic monitoring instinct inverts. A trough of 1.8 mg/L on a q8h regimen is technically "within range" below the 2 mg/L ceiling, yet the patient never drops below a concentration that keeps loading tubular cells for all 24 hours. A once-daily patient with a peak of 25 mg/L and an undetectable trough spends roughly 12 to 16 hours of every interval below 1 mg/L, and during that window the tubular cells release what they took up. Total daily exposure — area under the curve — can be identical between the two regimens while the accumulated intracellular burden is not.
This is not a theoretical preference. Meta-analyses pooling thousands of patients have consistently found once-daily aminoglycoside dosing at least as effective as multiple-daily dosing, with nephrotoxicity rates equal or lower. The calculator flags the drug-free hours in each interval for exactly this reason: on a 24-hour interval it is a feature, and if it shrinks toward zero the regimen has quietly become the thing once-daily dosing was designed to avoid.
Why a bigger dose less often is safer, not riskier
Three pharmacodynamic properties make gentamicin behave unlike a beta-lactam. First, killing is concentration-dependent: the rate and extent of bacterial death scale with how far the peak exceeds the organism's minimum inhibitory concentration. The threshold repeatedly identified in clinical outcome studies is a Cmax/MIC ratio of 8 to 10, and higher ratios also suppress the emergence of adaptive resistance.
Second, gentamicin has a post-antibiotic effect. Gram-negative growth stays suppressed for roughly 2 to 8 hours after concentrations fall below the MIC, so the drug keeps working after it has functionally left the blood. Third, gram-negative bacteria show adaptive resistance — a reversible downregulation of aminoglycoside uptake that develops during sustained exposure and reverses during a drug-free interval. Continuous low concentrations actively train the organism to resist; intermittent high concentrations do not.
Put the three together and the arithmetic favours concentration over frequency. Take a 70 kg patient with normal renal function. A 490 mg once-daily dose produces a peak near 25 mg/L, a Cmax/MIC ratio of 25 against an organism with an MIC of 1 mg/L, and an AUC₂₄ around 110 mg·h/L. Splitting a similar daily exposure into 120 mg every 8 hours produces a peak of 7.2 mg/L — a ratio of 7.2, below the effective threshold — and a trough of 1.16 mg/L that never lets the tubules unload. Same drug, similar daily milligrams, materially different pharmacodynamics.
Which weight? The 1.2 × IBW rule
Gentamicin is a hydrophilic molecule with a volume of distribution around 0.26 L/kg. It distributes into extracellular water and lean tissue and barely enters adipose tissue at all. Dose it on scale weight in an obese patient and you are calculating milligrams for a compartment the drug never reaches. The convention that resolves this has three branches:
- Scale weight below ideal body weight — use the actual weight. Underweight patients have less lean mass than the Devine equation predicts, and using IBW would overdose them.
- Scale weight between IBW and 1.2 × IBW — use ideal body weight. The extra kilograms are within normal body-composition variation.
- Scale weight at or above 1.2 × IBW — use adjusted body weight: IBW + 0.4 × (actual − IBW). The 0.4 coefficient is the empirically fitted fraction of excess mass that gentamicin actually penetrates.
The magnitude is easy to underestimate. A 180 cm man weighing 140 kg has an ideal body weight of 75 kg and an adjusted body weight of 101 kg. At 7 mg/kg that is 710 mg on adjusted weight versus 980 mg on scale weight — a 270 mg difference, 38% more drug, delivered to a compartment that cannot hold it. The adjusted body weight calculator shows the same arithmetic in isolation if you want to check it against a pharmacy worksheet.
The same dosing weight then feeds the Cockcroft-Gault estimate that sets the interval, which is where a second error compounds the first. Cockcroft-Gault was derived against lean body mass, so plugging scale weight into it inflates creatinine clearance in obesity and shortens the interval the nomogram returns. If you want to see that calculation on its own, the creatinine clearance calculator and the Cockcroft-Gault calculator both expose the weight choice explicitly rather than hiding it.
Choosing your regimen: a decision framework
Extended-interval dosing is the default for serious gram-negative infection in a haemodynamically recovering adult with stable renal function. It is not the default everywhere, and the exceptions are specific rather than vague. Work down this list in order — the first row that matches decides the regimen.
| If this is true | Use | Because |
|---|---|---|
| Enterococcal or streptococcal endocarditis | Synergy: 1 mg/kg q8h | Synergy with a cell-wall agent needs sustained low levels, not a high peak. Target peak 3–4 mg/L. |
| CrCl under 30 mL/min, or fluctuating creatinine | Single dose, then redose by level | The interval needed to clear the trough exceeds 48 h and cannot be predicted from an unstable creatinine. |
| Pregnancy, burns over 20% BSA, ascites, major fluid shifts | Traditional q8h with levels | Volume of distribution moves from 0.26 toward 0.4 L/kg, so predicted peaks stop being reliable. |
| Neonates, dialysis, or CRRT | Neither — use a dedicated protocol | Cockcroft-Gault does not apply, and clearance is set by the circuit, not the kidney. |
| None of the above, serious gram-negative infection | Extended-interval 5–7 mg/kg | Highest Cmax/MIC, longest drug-free window, simplest monitoring. |
The 5 versus 7 mg/kg choice inside extended-interval dosing is a genuine judgement call rather than a settled question. Seven milligrams per kilogram is the Hartford protocol figure and gives more headroom against organisms with an MIC of 2 mg/L, where 5 mg/kg would land a Cmax/MIC ratio around 9. Five milligrams per kilogram is common for urinary source infection and in older patients where the organism is likely susceptible at an MIC of 0.5 to 1 mg/L. Set the MIC selector in the calculator to the value your laboratory reported and let the ratio decide, rather than picking the milligram figure by habit.
Worked example: 82 kg man, creatinine 1.4 mg/dL
A 66-year-old man, 178 cm and 82 kg, is admitted with urosepsis and a blood culture growing Escherichia coli at a gentamicin MIC of 1 mg/L. Serum creatinine is 1.4 mg/dL and has been stable across two days. He is not in shock, not pregnant, has no ascites, and is not on dialysis. The decision framework sends him to extended-interval dosing.
- Ideal body weight. 178 cm is 70.1 inches, so 10.1 inches over 60. IBW = 50 + 2.3 × 10.1 = 73.2 kg.
- Pick the dosing weight. 1.2 × 73.2 = 87.8 kg. His 82 kg sits between IBW and that threshold, so dose on ideal body weight: 73.2 kg, not 82 kg.
- Creatinine clearance. (140 − 66) × 73.2 ÷ (72 × 1.4) = 53.7 mL/min.
- Interval from the nomogram. 53.7 falls in the 40–59 mL/min band, so every 36 hours.
- Dose. 7 mg/kg × 73.2 = 512 mg, rounded to the nearest 10 mg vial increment: 510 mg IV every 36 hours.
- Check the predicted exposure. Vd = 0.26 × 73.2 = 19.0 L. kₑ = 0.00293 × 53.7 + 0.014 = 0.171 h⁻¹, a half-life of 4.0 hours. Predicted peak 25.7 mg/L, predicted trough 0.06 mg/L, AUC₂₄ 104 mg·h/L.
- Confirm the ratio. Cmax/MIC = 25.7 ÷ 1 = 25.7, comfortably above the threshold of 10.
Every number lands where it should: peak inside 15–30 mg/L, trough far under 1 mg/L, AUC₂₄ inside the 70–120 mg·h/L exposure window associated with acceptable nephrotoxicity risk. Note what dosing on scale weight would have produced instead — 7 × 82 = 574 mg, rounded to 570 mg, a 12% overdose that pushes the predicted peak past 28 mg/L for no clinical gain. Sixty milligrams sounds trivial until it is repeated every 36 hours for a week.
What the Hartford nomogram actually asks of you
The Hartford protocol is the most widely cited extended-interval method, and it is frequently half-implemented. Its dosing arm — 7 mg/kg with the interval set by creatinine clearance — is what the calculator above reproduces. Its monitoring arm is a separate step that many services skip: draw one random serum level between 6 and 14 hours after the start of the infusion, plot the concentration against the elapsed time on the published nomogram, and let the region it lands in dictate whether the interval becomes 24, 36, or 48 hours.
The timing window is not arbitrary. Sampling before 6 hours risks catching the distribution phase, when the concentration is still equilibrating between plasma and tissue and reads artificially high. Sampling after 14 hours in a patient with good clearance can put the level below the assay's reliable range, which the nomogram cannot interpret. If a level lands on or above the q48h line, the protocol calls for holding the drug and reassessing rather than simply stretching the interval further.
One structural point worth carrying across drugs: aminoglycoside monitoring is a peak-driven discipline, while modern vancomycin monitoring has moved to an AUC-driven one. If you are dosing both in the same septic patient — a common combination for empiric gram-negative plus MRSA coverage — the vancomycin calculator targets an AUC₂₄/MIC of 400–600, a completely different objective function from the Cmax/MIC ratio of 10 you are aiming at here. Applying one drug's monitoring logic to the other is a recurring source of error.
Five errors that turn a good regimen nephrotoxic
Cutting the dose instead of lengthening the interval. When a trough comes back high, the reflex is to reduce milligrams. That lowers the peak, which is the part doing the killing, while barely changing how long the level stays elevated. The correct move is to hold the dose and stretch the interval — going from q24h to q36h drops the AUC by a third and leaves the peak untouched.
Trusting a creatinine that has not stabilised. Serum creatinine lags a change in glomerular filtration by 24 to 48 hours. In early sepsis with an acute kidney injury in progress, a creatinine of 1.1 mg/dL can reflect a true clearance far below what Cockcroft-Gault returns, and the interval the nomogram picks will be too short. Recheck daily during aminoglycoside therapy, and treat a rise of 0.3 mg/dL or more as a signal to reassess the whole regimen.
Sampling the peak at the wrong moment. For traditional dosing the peak is drawn 30 minutes after a 30-minute infusion ends, not at the end of the infusion itself, because the distribution phase takes about half an hour to complete. Draw it early and the reported peak overstates the true value, prompting a dose reduction that the patient did not need.
Letting the course run long. Nephrotoxicity risk climbs sharply beyond 7 days of therapy, and vestibular toxicity — which for gentamicin is more common than hearing loss and often permanent — is strongly duration-dependent. Aminoglycosides are best used as short empiric cover or targeted synergy, with a defined stop date at the outset rather than a decision deferred to daily rounds.
Stacking nephrotoxins without adjusting anything. Concurrent vancomycin, loop diuretics, amphotericin B, NSAIDs, IV contrast, or a calcineurin inhibitor each raise the probability of acute kidney injury on gentamicin. The combination does not merely add risk, it changes the monitoring plan: measured levels rather than predicted ones, and daily rather than twice-weekly creatinine. The same principle applies to any weight-based regimen in a dosage calculator — the arithmetic assumes the elimination pathway is intact, and it silently fails when another drug is closing that pathway down.
References
- National Library of Medicine, StatPearls. Gentamicin: pharmacology, dosing, toxicity, and monitoring.
- U.S. Food and Drug Administration. Gentamicin injection prescribing information — dosing, serum concentration targets, and nephrotoxicity warnings.
- National Institute of Diabetes and Digestive and Kidney Diseases. Kidney disease information and glomerular filtration.

Written by Jurica Šinko
Founder & CEO
Entrepreneur and health information advocate, passionate about making health calculations accessible to everyone through intuitive digital tools.
View full profileFrequently Asked Questions
What is a normal peak and trough for gentamicin?
It depends on the regimen. Extended-interval dosing at 5 to 7 mg/kg targets a peak of 15 to 30 mg/L and a trough under 1 mg/L. Traditional q8h dosing for serious gram-negative infection targets a peak of 6 to 10 mg/L and a trough under 2 mg/L. Endocarditis synergy dosing at 1 mg/kg q8h targets a much lower peak of 3 to 4 mg/L with a trough under 1 mg/L.
Do you use actual or ideal body weight for gentamicin?
Use actual weight only if it is below ideal body weight. Between IBW and 1.2 times IBW, dose on ideal body weight. At or above 1.2 times IBW, dose on adjusted body weight, calculated as IBW plus 0.4 times the excess over IBW. For a 180 cm man weighing 140 kg, that is 101 kg rather than 140 kg, which changes a 7 mg/kg dose from 980 mg to 710 mg.
How do you calculate a gentamicin dose by weight?
Multiply the milligram-per-kilogram figure by the dosing weight, not scale weight. Extended-interval dosing uses 5 to 7 mg/kg, traditional dosing uses 1.7 to 2 mg/kg, and synergy dosing uses 1 mg/kg. Round the result to the nearest 10 mg, then set the interval from creatinine clearance: 24 hours above 60 mL/min, 36 hours at 40 to 59, and 48 hours at 20 to 39.
Why is once-daily gentamicin better than every 8 hours?
Gentamicin killing is concentration-dependent, so a peak 10 times the organism MIC kills faster and suppresses adaptive resistance better than repeated small peaks. Uptake into renal tubular cells is saturable, so a high peak followed by 12 or more drug-free hours produces less intracellular accumulation than a continuously elevated level. Pooled trials show once-daily dosing is at least as effective with equal or lower nephrotoxicity.
What gentamicin trough level is dangerous?
A trough above 2 mg/L on traditional dosing, or any detectable trough above 1 mg/L on once-daily dosing, signals that the drug is accumulating and raises nephrotoxicity risk. The correct response is to lengthen the interval rather than cut the dose, because reducing milligrams lowers the peak that drives efficacy while barely shortening the time spent at elevated concentrations.
When should gentamicin levels be drawn?
For traditional dosing, draw the peak 30 minutes after a 30-minute infusion finishes, once distribution is complete, and the trough within 30 minutes before the next dose. For extended-interval dosing using the Hartford method, draw a single random level between 6 and 14 hours after the infusion starts and plot it on the nomogram. Sampling before 6 hours catches the distribution phase and overstates the result.
Can gentamicin be given once daily in kidney failure?
Most protocols stop extending the interval below a creatinine clearance of 30 mL/min, because the time needed for the trough to fall under 1 mg/L stretches beyond 48 hours. Below that threshold, give a single dose and redose only when a measured level confirms adequate clearance. Extended-interval dosing is also avoided in dialysis, continuous renal replacement therapy, and any patient whose creatinine is still moving.
How is gentamicin monitoring different from vancomycin?
Gentamicin is monitored on the peak because its killing is concentration-dependent, with a Cmax to MIC ratio of 10 or above as the goal. Modern vancomycin monitoring targets an AUC over 24 hours divided by MIC of 400 to 600 instead, since vancomycin killing depends on total exposure rather than peak height. Applying vancomycin trough logic to gentamicin leads to unnecessary dose reductions.
Related Calculators

Adjusted Body Weight Calculator — Dosing Weight (ABW)
Compute ABW for dosing with our adjusted body weight calculator, alongside IBW reference. Essential for accurate medication dosing, especially in obesity.

Alcohol Calculator: Drinks, Calories, Cost and BAC
Use our alcohol calculator to track standard drinks, alcohol calories, cost, and estimated BAC. Plan sessions, see time to sober, and make informed choices.

Alcohol Units Calculator UK — Weekly Tracking & Limits
Free alcohol units calculator for UK weekly tracking. Convert drinks to units, check against the 14-unit guideline, and see calories, standard drinks, and more.

BAC Calculator — Estimate Blood Alcohol Level by Drink
Use our BAC calculator to estimate blood alcohol levels from drinks, ABV, weight, sex, and hours. See limit markers, impairment ranges, and time to sober.

Caffeine Calculator: Daily Intake Tracker & Safe Limits
Use our caffeine calculator to total daily milligrams from coffee, tea, energy drinks, and custom doses, then check the running total against the 400 mg limit.
Carboplatin AUC Calculator — Calvert Formula Dosing
Free carboplatin AUC calculator using the Calvert formula to find chemotherapy dose in mg from target AUC, GFR, and Cockcroft-Gault creatinine clearance.