Use the Conicity Index Calculator
Free conicity index calculator measures central obesity from waist, weight, and height, scoring how cylindrical your body shape is for cardiovascular risk.
Adult range: 140–210 cm.
Weight sets the reference cylinder size.
At the navel, after a gentle exhale.
You are within 0.07 of the 1.25 threshold. Worth watching your waist trend.
Companion waist-to-height ratio: 0.526 (general target ≤ 0.50).
Men: values at or above this were linked to elevated cardiovascular risk in population studies.
| Conicity index | Shape | Reading |
|---|---|---|
| 1.00 – 1.10 | Near-cylinder | Little abdominal tapering |
| 1.10 – 1.25 | Mild taper | Typical for many adults |
| 1.25 – 1.40 | Conical | At/above the male risk cutoff |
| 1.40 – 1.73 | Double-cone | Marked central adiposity |
Your rating helps improve Conicity Index Calculator. We store only an anonymized vote (no personal data).
How to Use Conicity Index Calculator
Step 1: Set units and sex
Pick Metric or US/Imperial, then choose your sex so the tool applies the right risk cutoff (1.25 for men, 1.18 for women).
Step 2: Enter height and weight
Type your height and weight. Weight sizes the reference cylinder that the conicity index formula compares your waist against.
Step 3: Measure and enter your waist
Wrap a non-stretch tape around your abdomen at the navel after a gentle exhale, then enter the waist circumference.
Step 4: Read your conicity index
Your index updates instantly on the 1.00–1.73 cylinder-to-double-cone scale, with a shape label and your sex-specific cutoff.
Step 5: Compare and track
Check the companion waist-to-height ratio, copy the summary, and re-measure monthly to follow the trend rather than one reading.
Key Features
- Uses the Valdez conicity index formula from waist, weight, and height
- No hip measurement needed — unlike waist-to-hip ratio
- Sex-specific cardiovascular risk cutoffs (men 1.25, women 1.18)
- Cylinder-to-double-cone shape scale from 1.00 to 1.73
- Companion waist-to-height ratio for a second opinion
- Metric and US units with instant auto-calculation
Understanding Results
Conicity Index Calculator Formula
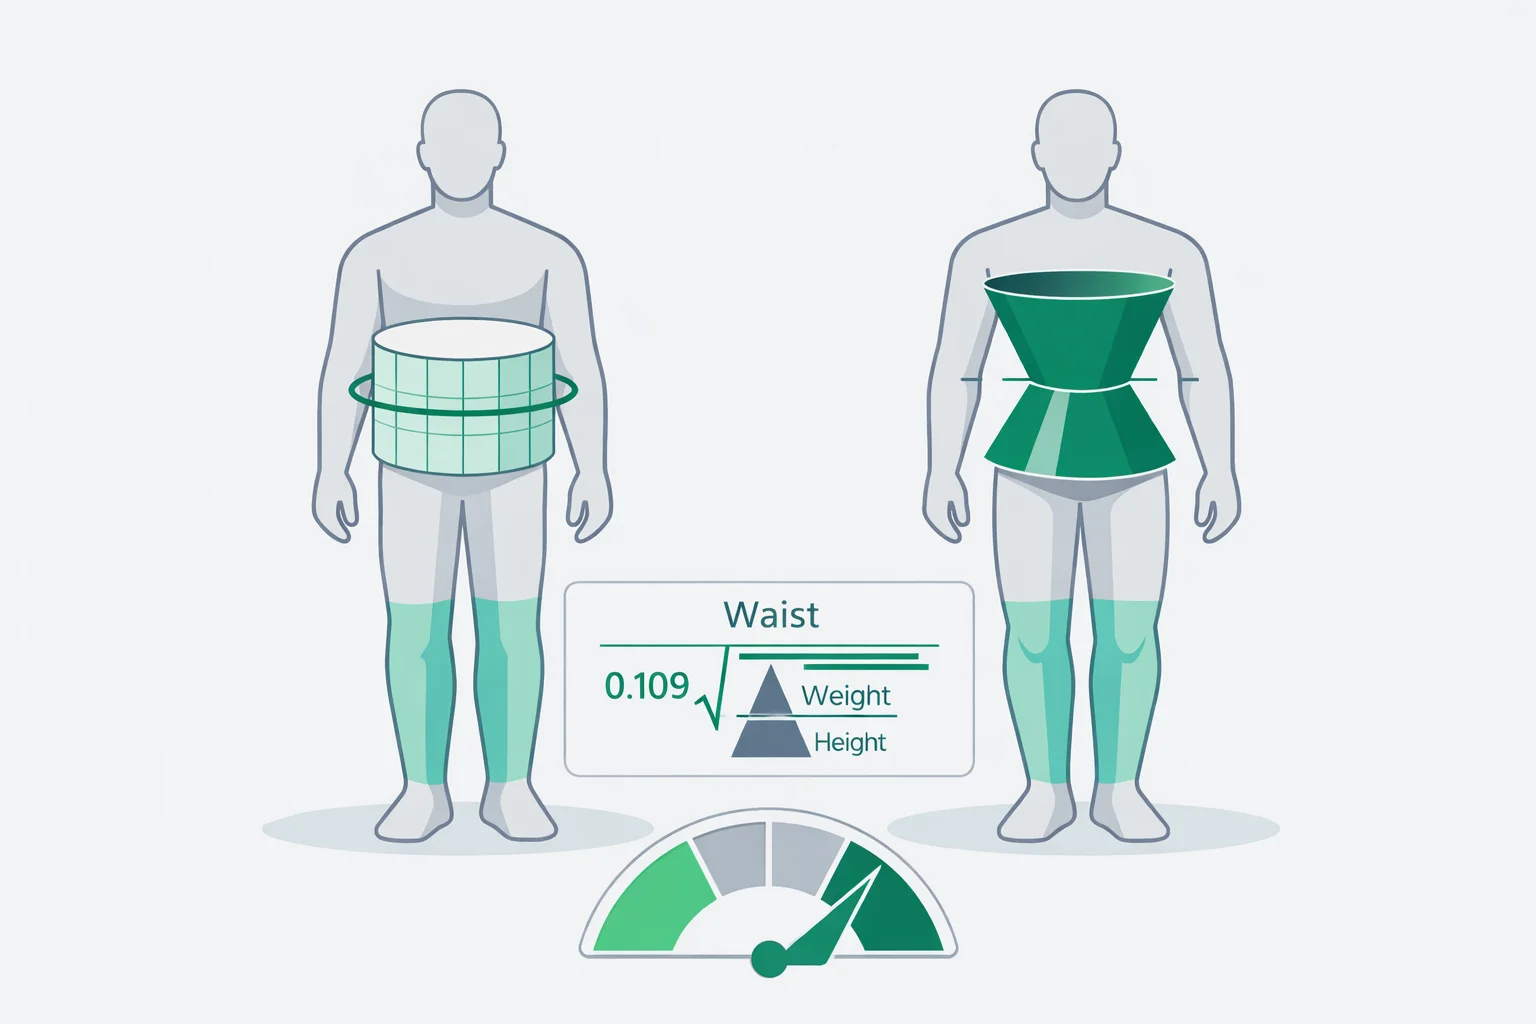
The conicity index (Valdez, 1991) compares your actual waist to the waist a person of your weight and height would have if their body were a perfect cylinder:
C = waist (m) ÷ [ 0.109 × √(weight in kg ÷ height in m) ]
Waist is entered in centimeters or inches and converted to meters. The constant 0.109 comes from the geometry of a cylinder at an assumed body density of about 1,050 kg/m³ — it turns the square-root term into the circumference of that reference cylinder. Divide your real waist by that reference and you get a dimensionless number. Example: a 92 cm waist, 82 kg, 175 cm gives 0.92 ÷ (0.109 × √(82 ÷ 1.75)) = 0.92 ÷ 0.746 ≈ 1.23.
Reference Ranges & Interpretation
Because the formula is bounded by geometry, values run from 1.00 (a perfect cylinder) to 1.73 (a perfect double cone). Most adults sit between 1.10 and 1.35. Population studies of coronary risk (Pitanga & Lessa, 2004) placed the elevated-risk threshold at about 1.25 for men and 1.18 for women — the sex-specific cutoffs this calculator flags.
- 1.00–1.10: near-cylindrical trunk, little abdominal tapering.
- 1.10–1.25: mild taper — the range most adults fall into.
- 1.18/1.25 and above: conical profile at or over the female/male cutoff.
- 1.40–1.73: pronounced double-cone shape, marked central adiposity.
Assumptions & Limitations
The index assumes a fixed body density and a standing, relaxed posture, so a heavily muscled midsection or a bloated abdomen can inflate it. Published cutoffs were derived largely in adult and Brazilian cohorts; optimal thresholds shift with ethnicity and age, and the index is not validated for children, pregnancy, or athletes with very high muscle mass. Treat it as a screening signal to pair with waist-to-height ratio and lab work — not a diagnosis. See a clinician if your index trends upward alongside rising blood pressure, glucose, or lipids.
Complete Guide: Conicity Index Calculator
On this page
A conicity index calculator turns three tape-and-scale numbers — waist, weight, and height — into a single figure that describes how much your trunk has tapered from a straight cylinder toward a double cone. That mental picture is the whole idea. A perfectly cylindrical body scores 1.00; a body that bulges at the middle and narrows at the ends, like two ice-cream cones joined base to base, scores up to 1.73. Where you land between those two extremes is a fast, hip-free read on central obesity — the belly fat that sits closest to your organs and tracks most tightly with cardiovascular and metabolic risk.
This guide explains the geometry behind the index, walks through the actual arithmetic with real numbers, shows what the 1.25 (men) and 1.18 (women) cutoffs mean, and clarifies why the conicity index deliberately ignores your hips. You’ll also see how it lines up against the BMI calculator, waist-to-height ratio, and body roundness index so you can read several shape metrics as a set instead of trusting any one number.
Your torso, between a cylinder and a double cone
Most body-shape metrics compare you to other people. The conicity index compares you to a shape. Picture a cylinder that holds exactly your weight at exactly your height — same volume, same length, uniform width top to bottom. That cylinder has a specific waist circumference dictated purely by geometry. Now measure your real waist. If the two match, your index is 1.00 and your trunk is, mathematically, as straight-sided as a soda can. As your real waist grows past the cylinder’s waist, the index climbs, because your middle is ballooning relative to a body of the same mass and stature.
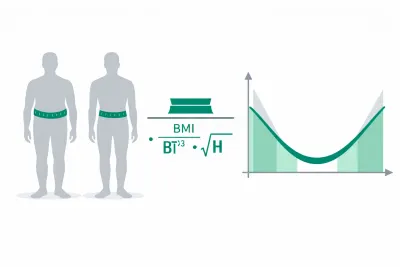
The ceiling of 1.73 is not arbitrary. It is the square root of 3, the exact ratio you get when a cylinder is deformed into a double cone of the same height and volume. So the whole scale is anchored to real solid geometry: 1.00 is a cylinder, 1.73 is a double cone, and everyone lives on the line between. In practice almost no adult reaches either extreme — typical values run from about 1.05 to 1.45 — which is exactly why a shift of even 0.10 is meaningful rather than trivial.
The conicity index formula, decoded
Ramon Valdez published the index in 1991, and the equation has not changed since:
Conicity index = waist (m) ÷ [ 0.109 × √(weight in kg ÷ height in m) ]
Three things deserve attention. First, waist must be in meters, not centimeters — a 92 cm waist becomes 0.92. Forgetting that conversion is the single most common reason a hand calculation comes out ten times too big. Second, weight is in kilograms and height in meters, and the square root of their ratio is what sets the size of the reference cylinder. Third, that stubborn 0.109 is the constant that makes the units cancel; it bakes in an assumed average body density of roughly 1,050 kg/m³, which is why the result is a clean, unitless number rather than a measurement in centimeters.
Notice what is missing: there is no hip measurement, no skinfold, no age, and no body-fat estimate. Waist does the heavy lifting, while weight and height build the cylinder it is judged against. That minimalism is the index’s selling point — you can compute it from a bathroom scale, a stadiometer, and a cloth tape.
A worked example: 92 cm waist, 82 kg, 175 cm
Take a 40-year-old man: waist 92 cm, weight 82 kg, height 175 cm. Work it in order:
- Convert waist to meters: 92 cm → 0.92 m. Convert height to meters: 175 cm → 1.75 m.
- Weight ÷ height = 82 ÷ 1.75 = 46.86.
- Square root of 46.86 = 6.85.
- Multiply by the constant: 0.109 × 6.85 = 0.746. This is the reference cylinder’s waist in meters.
- Divide real waist by reference: 0.92 ÷ 0.746 = 1.23.
A 1.23 sits just below the male cutoff of 1.25, in the “mild taper” band most adults occupy — a hair from the elevated-risk line. Trim the waist to 88 cm and the index falls to about 1.18; let it drift to 100 cm and it climbs to roughly 1.34. That sensitivity is the point: because the denominator barely moves unless your weight changes a lot, the conicity index mostly tracks your waist, so a few centimeters off your midsection visibly moves the number even when the scale holds steady.
What counts as a high conicity index?
There is no WHO grading table for the conicity index the way there is for BMI, but a large Brazilian coronary-risk study (Pitanga & Lessa, 2004) identified practical cutoffs: about 1.25 for men and 1.18 for women marked the point where discriminatory power for cardiovascular risk was strongest. Above those lines, the odds of an unhealthy metabolic profile rise. The table below shows why the index earns its keep: two people can share an identical BMI of 26.8 yet sit on opposite sides of the cutoff.
| Person | Height / weight | Waist | BMI | Conicity index |
|---|---|---|---|---|
| A — pear | 175 cm / 82 kg | 82 cm | 26.8 | 1.10 |
| B — apple | 175 cm / 82 kg | 100 cm | 26.8 | 1.34 |
Same scale weight, same BMI, same height — and yet Person B’s 18 extra centimeters of waist push the conicity index from a cylinder-like 1.10 to a distinctly conical 1.34, well over the 1.25 threshold. BMI called them identical; the conicity index flagged the one carrying the risk. For a body-fat read on the same measurements, the body fat percentage calculator is a useful companion.
Conicity index vs. waist-to-hip ratio: why skip the hips?
The obvious rival is the waist-to-hip ratio, which divides waist by hip circumference. Both aim at the same target — abdominal fat distribution — but they disagree on how to get there. Waist-to-hip ratio needs a clean hip measurement, and the hip is a notoriously slippery landmark: place the tape over the widest part of the buttocks one week and an inch higher the next, and the ratio shifts even though nothing about your body changed. The conicity index sidesteps that entirely by replacing the hip term with weight and height, two figures you can nail to the gram and the millimeter.
The trade-off is interpretation. Waist-to-hip ratio has decades of clinical familiarity and simple thresholds (roughly above 0.90 for men and 0.85 for women). The conicity index is less widely quoted, so fewer clinicians will recognize a 1.30 on sight. In research that pits them head to head, the two usually perform comparably for predicting cardiovascular outcomes, with the conicity index winning on measurement reliability and losing on name recognition. If you want the reliability without giving up a familiar scale, the waist-to-height ratio (target ≤ 0.50) is the third option worth keeping on screen.
Where the conicity index breaks down
The formula assumes a fixed body density near 1,050 kg/m³. That holds for a broad slice of adults but not for everyone. A powerlifter with a thick, muscular midsection can post a conicity index above 1.25 while carrying single-digit body fat, because the tape does not know whether a wide waist is muscle or visceral fat. At the other end, a large meal or bloating can add two centimeters to your waist and 0.03 to your index within an hour — which is why a single reading means little and a monthly trend means a lot.
The cutoffs also travel poorly. They were derived largely in adult Brazilian cohorts, and optimal thresholds shift with ethnicity and age — South Asian populations, for instance, tend to carry cardiometabolic risk at lower waist sizes. The index is not validated for children, for pregnancy, or for people whose abdominal shape makes navel-level tape placement ambiguous. Read it as a screening nudge, not a verdict, and always alongside blood pressure, fasting glucose, and lipids.
Putting your conicity index to work
The most useful thing you can do with the index is track it. Measure your waist at the navel first thing in the morning, after exhaling, using the same non-stretch tape each time, and log the index monthly. Because the number is waist-dominant, a steady fat-loss plan shows up here even during a muscle-building phase when the scale — and therefore BMI — refuses to budge. Aim for the direction of travel, not a perfect reading on any one day.
Pair the index with an energy plan rather than a crash diet. The TDEE calculator estimates your daily maintenance calories, and a modest 300–500 kcal deficit paired with resistance training two to three times a week preserves muscle while the waist shrinks. If a high conicity index shows up next to other warning signs, plug your numbers into the heart disease risk calculator and take the combined picture to your clinician. One shape metric is a hint; several pointing the same way is a reason to act.
References
- Valdez R. A simple model-based index of abdominal adiposity. Journal of Clinical Epidemiology, 1991;44(9):955–956.
- Pitanga FJG, Lessa I. Anthropometric indexes of obesity as an instrument of screening for high coronary risk in adults. Arquivos Brasileiros de Cardiologia, 2004.
- World Health Organization. Obesity and overweight fact sheet.

Written by Jurica Šinko
Founder & CEO
Entrepreneur and health information advocate, passionate about making health calculations accessible to everyone through intuitive digital tools.
View full profileFrequently Asked Questions
What is a good conicity index?
A value below your sex cutoff is generally considered lower risk: under 1.25 for men and under 1.18 for women. Most adults land between 1.10 and 1.25. A score near 1.00 means a near-cylindrical trunk, while 1.73 is the theoretical double-cone maximum.
What is the conicity index formula?
Conicity index = waist in meters divided by (0.109 times the square root of weight in kg over height in meters). The 0.109 constant scales your measurements against a hypothetical cylinder of the same weight and height. Convert your waist from centimeters to meters before using the formula by hand.
What is the difference between the conicity index and waist-to-hip ratio?
The conicity index needs only waist, weight, and height — no hip measurement. Waist-to-hip ratio divides waist by hips. Because hip landmarks are hard to find consistently, the conicity index removes that measurement error while still capturing central fat.
Is a conicity index of 1.3 high?
Yes. A 1.3 sits above both the male cutoff of 1.25 and the female cutoff of 1.18, placing you in the conical band linked to more abdominal fat. Cross-check it against your waist-to-height ratio and blood markers before drawing conclusions.
Can the conicity index be below 1.0 or above 1.73?
In practice, no. 1.00 is the geometric floor for a perfect cylinder and 1.73 is the ceiling for a perfect double cone. Real adults almost always fall between about 1.05 and 1.45, so a value outside that window usually points to a measurement or unit error.
Does the conicity index work if I have a lot of muscle?
Better than BMI, but not perfectly. Because it targets the waist, it is not fooled by muscular legs or arms. A heavily muscled midsection can still widen your waist and lift the index, so pair the result with a body-fat percentage estimate.
How is the conicity index different from BMI?
BMI uses only weight and height, so it cannot see where fat sits. The conicity index adds waist circumference, which means two people with an identical BMI of 27 can score very differently — the one carrying weight around the abdomen scores higher.
Related Calculators
ABSI Calculator: A Body Shape Index & Mortality Risk
Free ABSI calculator computes A Body Shape Index from waist, height, and BMI to estimate visceral fat and mortality risk independent of body mass index.

Adult BMI Calculator for Men & Women — WHO BMI Guide
Use the adult BMI calculator to find your BMI with WHO categories. Enter metric or imperial units to see your status and BMI ranges quickly and clearly.

Army Body Fat Calculator — AR 600‑9 Standard Compliance
Check compliance with the Army body fat calculator per AR 600-9 standards. Enter circumference measures by sex to estimate body fat % and see pass/fail status.
Body Composition Calculator — Fat, Lean Mass Breakdown
Use our body composition calculator to estimate body fat percentage, fat mass, and lean mass from tape measurements. Switch units and get clear categories.

Body Fat Calculator — Percentage for Men & Women (Tape)
Estimate with the body fat percentage calculator (body fat calculator) using Navy circumference equations. Supports metric/imperial and sex‑specific inputs.

Body Measurement Calculator: Wrist Size & Frame Guide
Use our body measurement calculator to capture wrist, waist, hip, and height. View WHR, WHtR, and a wrist-based frame size hint with metric/US units and labels.