What Is a Good ASCVD Risk Score? The 7.5% and 20% Lines
For a 55-year-old man, dropping total cholesterol from 260 to 213 mg/dL moves his 10-year risk by about one percentage point. Taking up smoking doubles it. Here is what the 5%, 7.5% and 20% bands actually trigger, which inputs move the number most, and why the new PREVENT equations may have just halved your score.
Cholesterol Is Not What Moves an ASCVD Risk Score
An ASCVD risk score is the probability that you will have a heart attack or a stroke in the next ten years, and the thing most people expect to control it barely does. Take the reference patient from the 2013 ACC/AHA guideline: a 55-year-old white man, total cholesterol 213 mg/dL, HDL 50 mg/dL, untreated systolic blood pressure of 120 mmHg, no diabetes, non-smoker. His 10-year risk is about 5.3 percent.
Push his total cholesterol up to 260 — a number that would alarm most people who see it on a lab report — and the score moves to roughly 6.4 percent. Give the original man a cigarette habit instead and it roughly doubles, to around 11 percent. Give him diabetes and it lands near 11 percent as well. Add ten years to his age and change nothing else and it clears 12 percent.
That ordering is the whole point of the tool. Cholesterol is one of nine inputs and, on its own, a comparatively weak one. If you want your own figure before reading further, the ASCVD risk calculator runs the Pooled Cohort Equations; the rest of this article is about what the output actually authorises.
The Four Bands and What Each One Triggers
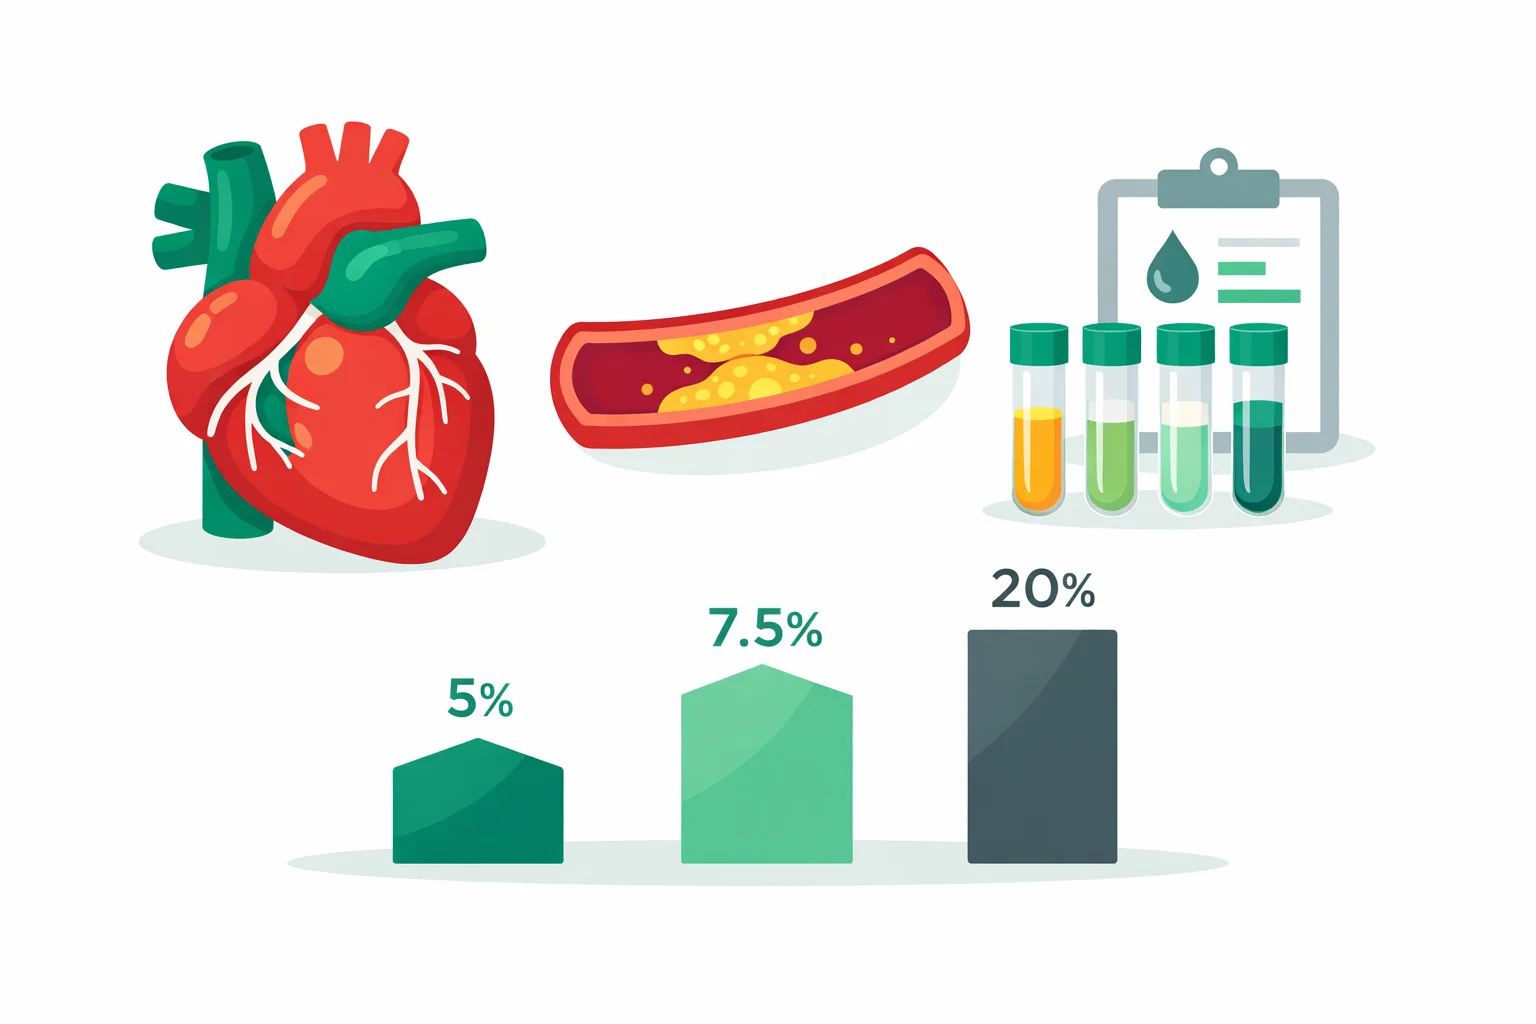
The 2018 AHA/ACC multisociety cholesterol guideline splits the 10-year estimate into four bands, and each one carries a different default action. The bands are not descriptions of health — they are decision thresholds.
| 10-year risk | Band | Guideline default | LDL-C goal |
|---|---|---|---|
| Under 5% | Low | Lifestyle only | — |
| 5% to under 7.5% | Borderline | Statin only if risk enhancers present | — |
| 7.5% to under 20% | Intermediate | Moderate-intensity statin | Lower LDL-C by 30–49% |
| 20% and above | High | High-intensity statin | Lower LDL-C by 50% or more |
What a good ASCVD risk score looks like at 45 versus 70
Reading the table without adjusting for age produces the most common misinterpretation we see. A 45-year-old at 6 percent is unusual — his risk is running ahead of his age, and something in his profile is doing it. A 70-year-old at 6 percent is exceptional in the other direction: most men that age clear 7.5 percent on age alone. The same number is a yellow flag in one case and a clean bill in the other, which is why “what is a good ASCVD risk score” has no single answer.
Why 7.5 percent became the treatment line
It came from a number-needed-to-treat argument, not from biology. At a 10-year risk of 7.5 percent, a moderate-intensity statin producing a roughly 25 percent relative risk reduction prevents about one event for every 50 to 60 people treated for ten years — a ratio the guideline committee judged favourable against the roughly 1 in 250 annual risk of new-onset diabetes and the muscle symptoms reported by a small minority. Below that risk, the arithmetic gets thin. There is nothing physiologically different about 7.4 and 7.6.
What the Pooled Cohort Equations Actually Take In
Nine inputs, and no more: age, sex, race, total cholesterol, HDL cholesterol, systolic blood pressure, whether that blood pressure is treated, diabetes status and smoking status. Notice what is absent — LDL cholesterol, family history, triglycerides, weight, exercise, and diet all sit outside the equation despite being the things people most often try to change.
Two of those inputs are worth flagging. Treated blood pressure carries a higher coefficient than the same untreated reading, because being on medication marks you as someone whose pressure was worse before. And the equations ask only whether you smoke now, not how much or for how long, so a two-a-day smoker and a pack-a-day smoker score identically.
Change one input at a time
Here is the sensitivity analysis for that 55-year-old reference man. Each row changes exactly one variable from the 5.3 percent baseline. Values are approximate PCE outputs and are here to show relative magnitude, not to substitute for running your own numbers.
| Single change from baseline | 10-year risk | Shift |
|---|---|---|
| Baseline (age 55, TC 213, HDL 50, SBP 120 untreated) | 5.3% | — |
| Total cholesterol 213 → 260 mg/dL | ~6.4% | +1.1 pts |
| HDL 50 → 35 mg/dL | ~7.0% | +1.7 pts |
| Systolic BP 120 → 140 mmHg, untreated | ~7.1% | +1.8 pts |
| Becomes a current smoker | ~10.8% | +5.5 pts |
| Develops diabetes | ~11.4% | +6.1 pts |
| Age 55 → 65, everything else identical | ~12.2% | +6.9 pts |
Three modifiable factors sit at the top of that list and only one of them is a lipid. Smoking cessation is the largest single lever any patient controls, and it is the only one that starts paying back within months. Blood pressure is second; if yours is the input in question, the blood pressure calculator shows which stage a reading falls into. For the lipid side, the cholesterol calculator works a full panel, and the LDL cholesterol calculator derives LDL from the Friedewald or Martin-Hopkins equation when the lab reports a calculated rather than a direct value.
Risk Enhancers: When a 6 Percent Score Gets Treated Like an 8
The borderline band from 5 to 7.5 percent exists precisely because the nine inputs miss things. The guideline lists risk enhancers that justify starting a statin at a score the table would otherwise leave alone. The ones that come up most often in practice:
- Family history of premature ASCVD — male relative under 55, female under 65
- LDL-C persistently 160 mg/dL or higher
- Metabolic syndrome, or chronic kidney disease with eGFR 15–59
- Triglycerides persistently 175 mg/dL or higher
- Lipoprotein(a) of 50 mg/dL or more, or apoB of 130 mg/dL or more
- hs-CRP of 2.0 mg/L or higher
- Chronic inflammatory disease — rheumatoid arthritis, psoriasis, HIV
- Preeclampsia history or menopause before 40
- South Asian ancestry, which the equations do not model at all
- Ankle-brachial index below 0.9
When the decision is still genuinely close, a coronary artery calcium scan breaks the tie better than any of these. A CAC of zero in an intermediate-risk adult supports deferring the statin and rechecking in 5 to 10 years. A CAC of 100 or more, or anything at or above the 75th percentile for your age and sex, settles it the other way regardless of what the percentage said.
PCE vs. PREVENT: Why Your Score May Have Just Dropped
The Pooled Cohort Equations were fitted on cohorts recruited between the 1970s and the 1990s. In those populations smoking was far more prevalent, blood pressure control was worse, and statins were barely in use. Validation work in contemporary cohorts — MESA and REGARDS among them — found the PCE overestimating observed event rates by roughly 25 percent in some groups and by more than 100 percent in others.
The AHA responded in 2023 with the PREVENT equations. Four changes matter. They run from age 30 rather than 40. They dropped race as an input and added eGFR, on the reasoning that kidney function is a mechanism while race is a proxy. They predict heart failure alongside heart attack and stroke. And they report a 30-year estimate alongside the 10-year one, which is far more informative for anyone under 50 whose ten-year number will always look reassuring.
The practical consequence is that a PREVENT score often comes in near half the PCE figure for the same person — enough to move a large number of adults out of the statin-eligible bands. US treatment thresholds have not been rewritten against PREVENT yet, so if a clinic hands you a number, ask which equation produced it. Comparing a PREVENT output against the 7.5 percent line is a category error.
Where the Score Breaks Down
The equations return nothing usable below age 40 or above 79. They were never intended for anyone with existing atherosclerotic disease — a prior heart attack, stroke, stent, bypass or peripheral arterial disease puts you in secondary prevention, where high-intensity statin therapy is indicated and the percentage is irrelevant. Familial hypercholesterolaemia is the other clean override: an untreated LDL of 190 mg/dL or above warrants a high-intensity statin whatever the 10-year figure says.
Two under-recognised failures are worth naming. The PCE model only white and African American adults, so estimates for South Asian, Hispanic and East Asian patients carry documented bias in both directions. And a single blood pressure reading taken in a clinic on one anxious morning can shift the score by close to two percentage points on its own — use an average of readings, not the worst one. If you want a second lens on the same question, the heart disease risk calculator weights the inputs differently and disagreement between the two is itself informative.
What to Do With Your Number
Under 5 percent: nothing changes clinically. Recheck in 4 to 6 years, which is the guideline interval for low-risk adults aged 40 to 75, and note that your number will drift upward on age alone.
Between 5 and 7.5 percent: go through the risk-enhancer list above line by line. That list, not the percentage, is what decides this band. Two or more enhancers and the conversation looks like the intermediate band.
Between 7.5 and 20 percent: this is where a calcium scan earns its cost, and where the target is a 30 to 49 percent reduction in LDL-C rather than a specific LDL number. At 20 percent and above, the discussion is about which high-intensity statin, not whether. In every band, one thing outranks the score: if you smoke, the sensitivity table above already told you where your largest available reduction is.
References
- Grundy SM, Stone NJ, et al. 2018 AHA/ACC Multisociety Guideline on the Management of Blood Cholesterol — risk bands, statin intensity thresholds and the risk-enhancer list.
- Khan SS, Matsushita K, et al. Development and Validation of the AHA PREVENT Equations (Circulation, 2023) — the successor model, its inputs and its calibration against the PCE.
Frequently Asked Questions
Is a 10 percent ASCVD risk score bad?
A 10 percent score sits in the intermediate band, which runs from 7.5 up to 20 percent, and it is the band where a moderate-intensity statin is recommended after a clinician-patient risk discussion. In plain terms it means roughly 1 in 10 people with that risk profile would have a heart attack or stroke within ten years, so 9 in 10 would not. It is a prompt for a conversation about statins and blood pressure, not an emergency.
What ASCVD score requires a statin?
The 2018 ACC/AHA cholesterol guideline recommends a moderate-intensity statin at 7.5 percent and above, and a high-intensity statin at 20 percent and above. Between 5 and 7.5 percent a statin is reasonable only if risk enhancers are present. Three situations override the score entirely: an LDL of 190 mg/dL or higher, diabetes between ages 40 and 75, and any established atherosclerotic disease.
What is a normal ASCVD risk score for a 50 year old?
Age drives the number more than anything else, so there is no single normal. A 50-year-old man with untreated systolic blood pressure of 120, total cholesterol of 213, HDL of 50, no diabetes and no smoking lands near 3 percent, comfortably in the low band. The same profile at 65 lands above 12 percent. Compare yourself against your own age group, not against a fixed target.
Why did my ASCVD risk score go up when nothing changed?
Because age is an input, and it went up. The Pooled Cohort Equations weight age heavily, so a healthy person who changes nothing typically sees their 10-year score climb by roughly 0.5 to 1 percentage point per year through their fifties and faster after 60. Crossing 7.5 percent purely by aging is the single most common reason a statin discussion starts.
What is the difference between ASCVD risk and Framingham risk?
Framingham predicts coronary heart disease events only, while the ASCVD Pooled Cohort Equations add stroke, which is why an ASCVD score usually reads higher for the same patient. The PCE were also derived from pooled community cohorts that included Black adults, whereas the original 1998 Framingham score came from one largely white town in Massachusetts. Framingham is still used, but current US guidelines set treatment thresholds off the PCE.
Can I use the ASCVD risk calculator if I am under 40?
No. The Pooled Cohort Equations are validated only for ages 40 to 79 and will not return a usable 10-year number below 40, because ten-year event rates in that age group are so low the estimate carries no signal. For adults aged 20 to 39 the guideline instead recommends estimating lifetime risk and treating LDL of 190 mg/dL or higher on its own. The newer PREVENT equations extend down to age 30.
Does a coronary calcium score of zero cancel a high ASCVD risk score?
It downgrades it rather than cancelling it. A CAC of zero in an intermediate-risk adult supports deferring a statin and rechecking in 5 to 10 years, and it is the guideline-endorsed tiebreaker when the decision is genuinely close. The exceptions are current smokers, people with diabetes, and those with a strong family history of premature disease, where a zero score does not justify holding off.
Why is my PREVENT score lower than my ASCVD risk score?
Because the PCE were built on cohorts recruited in the 1970s through 1990s, when smoking was far more common and statins were not yet in wide use, so they overstate risk in contemporary populations by an estimated 25 to over 100 percent depending on the group. The AHA PREVENT equations, published in 2023, were fitted on modern data and commonly return roughly half the PCE figure. US treatment thresholds are still written against the PCE, so the two are not interchangeable yet.

Written by Jurica Šinko
Founder & CEO
Entrepreneur and health information advocate, passionate about making health calculations accessible to everyone through intuitive digital tools.
View full profile