Use the Weight-for-Length Percentile Calculator
Free weight for length percentile calculator using WHO growth standards to check if your baby is proportional, wasted, or overweight from birth to age 2.
Weight-for-length percentile
47.7th
Sex
Units
Measured lying down. WHO chart covers 45–110 cm (birth to ~2 years).
Nude weight or clothing subtracted, e.g. 7.70
Weight-for-length percentile
47.7th
Normal weight-for-length (−2 to +1 SD)Weight is proportional to length — the range where most healthy infants fall.
Z-score
-0.06
Median weight at this length
7.74 kg
Normal band (−2 to +1 SD)
6.60 kg – 8.41 kg
Overweight from (+2 SD)
9.16 kg
Obesity from (+3 SD)
10.01 kg
Difference vs median
−0.04 kg
WHO percentile weights at 67.0 cm (boys)
| Percentile | Weight | Z-score |
|---|---|---|
| 3rd percentile | 6.66 kg | -1.88 |
| 15th percentile | 7.11 kg | -1.04 |
| 50th percentile (median)← closest to your child | 7.74 kg | +0.00 |
| 85th percentile | 8.44 kg | +1.04 |
| 97th percentile | 9.07 kg | +1.88 |
Educational tool, not medical advice. Check this tool’s method and limitations before interpreting a result. Talk to a qualified healthcare professional before making decisions about medication, diet, exercise, or treatment. See our Terms of Use.
Your rating helps improve Weight-for-Length Percentile Calculator. We store only an anonymized vote (no personal data).
How to Use Weight-for-Length Percentile Calculator
Step 1: Select sex and units
Choose Boy or Girl, then pick cm/kg (metric) or in/lb (imperial). The correct WHO weight-for-length table loads automatically.
Step 2: Enter recumbent length
Type the baby’s length measured lying down. The WHO chart covers 45–110 cm (about 17.7–43.3 in), birth to roughly 2 years.
Step 3: Enter weight
Enter nude weight in kilograms, or pounds and ounces. A wet diaper can add 100–300 g, so subtract clothing where possible.
Step 4: Read the percentile and z-score
The result updates instantly, showing the percentile, WHO z-score, and whether the weight is wasted, normal, or overweight for that length.
Step 5: Check the reference table
Compare your child’s weight to the 3rd, 15th, 50th, 85th and 97th percentile weights listed for the exact length you entered.
Key Features
- Official WHO weight-for-length LMS tables (45-110 cm)
- Percentile and z-score with WHO SD classification
- Metric (cm/kg) and imperial (in/lb/oz) inputs
- Median and −2/+1/+2/+3 SD reference weights at any length
- Percentile weight table for the exact length entered
Understanding Results
Formula
The percentile comes from the WHO LMS method. Each half-centimeter of recumbent length stores three parameters — L (power that removes skew, −0.3521 for boys and −0.3833 for girls), M (median weight), and S (coefficient of variation). The z-score is z = [(weight / M)L − 1] / (L × S), then converted to a percentile with the standard normal distribution. For a 71 cm boy weighing 8.6 kg (M = 8.648, S = 0.08241), z ≈ −0.068, which is the 47th percentile.
Reference Ranges & Interpretation
WHO defines weight-for-length cutoffs in standard deviations, not round percentiles: below −2 SD (≈2.3rd percentile) is wasted and below −3 SD is severely wasted; +1 SD (84th) is “possible risk of overweight,” above +2 SD (97.7th) is overweight, and above +3 SD (99.9th) is obese. The band from −2 to +1 SD is the normal range where most healthy infants fall.
Assumptions & Limitations
This tool uses recumbent length, so it applies to infants measured lying down (45–110 cm, roughly birth to 2 years). Standing height, weighing in a diaper, or a soft-tape length reading will all skew the result. A single measurement is a screening snapshot, not a diagnosis — pediatricians judge growth by the trajectory across visits. Discuss any result below −2 SD or above +2 SD with your child’s healthcare provider.
Complete Guide: Weight-for-Length Percentile Calculator
On this page
A weight-for-length percentile calculator answers the one question the scale alone can’t: is your baby’s weight right for how long they are? Picture a 9-month-old boy at his well-baby visit. He weighs 8.6 kg and measures 71 cm lying down. His weight-for-age lands near the 25th percentile, and a worried parent hears “small.” But run those same numbers as weight-for-length and he sits at the 47th percentile—almost dead center. He isn’t underweight at all; he’s simply a shorter-than-average baby whose weight matches his frame perfectly. This guide walks that exact calculation through, then shows you how to read your own result.
Weight-for-length is the infant equivalent of BMI. Because babies under 2 are measured lying down, doctors don’t use BMI-for-age until age 2—they plot weight against recumbent length instead. The World Health Organization built these standards from the Multicentre Growth Reference Study, tracking healthy, breastfed children across six countries. The chart runs from 45 cm to 110 cm, roughly birth to 24 months.
A real 9-month-old: reading the chart start to finish
Let’s finish the boy above by hand so you can see what the calculator does in a millisecond. At 71 cm, the WHO weight-for-length table for boys gives three parameters: L = −0.3521, M (median weight) = 8.648 kg, and S (coefficient of variation) = 0.08241. His actual weight is 8.6 kg. The z-score formula is:
z = [(weight / M)L − 1] / (L × S) = [(8.6 / 8.648)−0.3521 − 1] / (−0.3521 × 0.08241) ≈ −0.068
A z-score of −0.068 converts to the 47th percentile. In plain terms: out of 100 healthy 71 cm boys, about 47 would weigh less than him and 53 would weigh more. He’s textbook proportional. Notice how differently that reads from his 25th weight-for-age percentile—same child, same scale, but the length-adjusted view tells the story that matters for nutrition.
This is why pediatricians reach for weight-for-length when a parent asks “is my baby too thin?” or “too chunky?” It strips out height entirely and asks only about body proportion. For the age-based view, pair this with our baby weight percentile calculator and baby length percentile calculator—together the three answer “is she growing?” and “is she in proportion?” separately.
Weight-for-length vs. weight-for-age: what’s the difference?
These two percentiles get confused constantly, and mixing them up changes the conclusion. Weight-for-age asks “how heavy is she compared to babies her age?” Weight-for-length ignores age completely and asks “how heavy is she compared to babies her length?” A tall, lean baby can be 90th for weight-for-age yet 40th for weight-for-length—heavy simply because she’s long, not because she’s carrying extra weight.
| Metric | Question it answers | Screens for | Best for |
|---|---|---|---|
| Weight-for-length | Is weight proportional to length? | Wasting, overweight | Body proportion, nutrition |
| Weight-for-age | Is weight typical for age? | Underweight, faltering growth | Overall weight tracking |
| Length-for-age | Is length typical for age? | Stunting | Linear growth |
The clinical rule of thumb: weight-for-age flags a baby who isn’t gaining, but only weight-for-length can tell you why—whether the low weight is proportional (a small, healthy baby) or a genuine mismatch (weight lagging behind a normal length, the signature of wasting).
The LMS math behind the weight-for-length percentile calculator
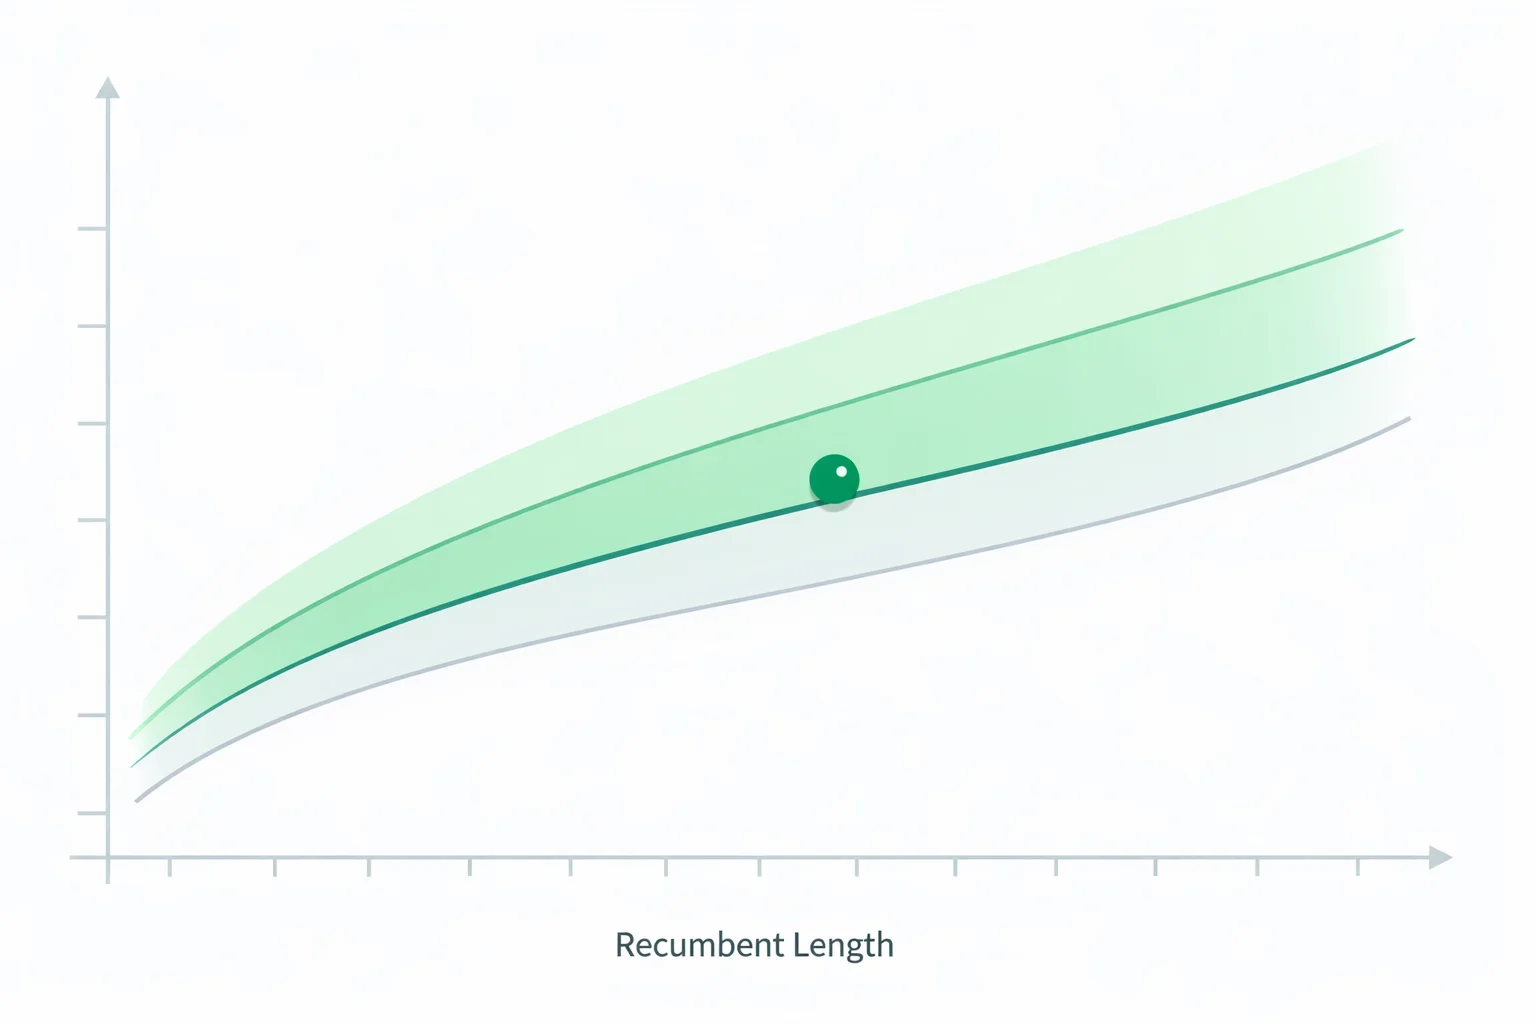
Growth charts aren’t simple bell curves—childhood weight distributions are skewed, with a longer tail toward heavier values. WHO handles this with the LMS method (Cole and Green, 1992), which stores three numbers at every half-centimeter of length: L (the Box-Cox power that removes skew), M (the median), and S (the coefficient of variation). For boys the L value holds steady at −0.3521 across the whole chart; for girls it’s −0.3833. Those negative L values are exactly what pull the curve to account for the skew.
Once the z-score is calculated, converting to a percentile uses the standard normal distribution. A z of 0 is the 50th percentile; +2 is the 97.7th; −2 is the 2.3rd. This calculator carries the official WHO tables at 0.5 cm resolution and interpolates linearly between grid points, so a 67.3 cm reading lands between the 67.0 and 67.5 cm rows rather than being rounded off. That precision matters near the edges—the difference between the 3rd and 5th percentile can be as little as 150 grams.
What the WHO zones mean: −2, +1, +2, +3 SD
WHO defines its weight-for-length cutoffs in standard deviations (SD), not round percentiles, and the bands are deliberately asymmetric. On the low side, below −2 SD (about the 2.3rd percentile) is classified as wasted, and below −3 SD as severely wasted. On the high side, the first warning line is +1 SD (the 84th percentile) for “possible risk of overweight,” +2 SD (97.7th) for overweight, and +3 SD (99.9th) for obese.
Why does overweight start its warning at +1 SD but wasting only at −2 SD? Because early excess weight-for-length is one of the strongest predictors of later childhood obesity, WHO pushed the upper alert line lower to catch it sooner. A single reading at the 88th percentile isn’t a diagnosis—but if the trend keeps climbing across visits, it’s worth a conversation. For toddlers who have crossed into standing-height measurement, switch to our child BMI percentile calculator, which applies the same SD logic to BMI-for-age.
Why we use WHO curves, not CDC, under age 2
The CDC explicitly recommends the WHO growth standards—not its own CDC charts—for all children from birth to 24 months in the United States. The reason is a difference in what each chart describes. The WHO curves are a standard: they show how children should grow under optimal conditions, built from breastfed babies with good nutrition and healthcare. The older CDC charts are a reference: they describe how a mostly formula-fed U.S. sample from the 1970s–90s actually grew, which ran heavier.
The practical consequence is real. A breastfed baby who is thriving can appear to “fall off” the CDC weight curve in the second half of the first year, because breastfed infants naturally gain more slowly after 3 months than the formula-fed CDC sample. On the WHO chart—the one this tool uses—that same baby tracks a steady percentile. That’s why every measurement here comes from the WHO Child Growth Standards.
Four measurement mistakes that shift the percentile
Because weight-for-length divides one measurement by another, an error in either input moves the result—sometimes dramatically.
- Standing height instead of recumbent length. A child measured standing reads roughly 0.5–1 cm shorter than lying down. Plug a standing height into a length chart and you’ll overstate the weight-for-length percentile, because you’re comparing the weight to a too-short length.
- Weighing in a diaper or clothes. A wet diaper alone can add 100–300 g. On a 5 kg newborn that’s enough to jump from the 50th to past the 70th percentile. Weigh nude or subtract a known clothing weight.
- Estimating length from a tape measure. A squirming baby measured with a soft tape can be off by 2–3 cm versus a proper length board with the head against a fixed end and legs extended. At the steep part of the curve, 2 cm of length error can shift the percentile by 15 points.
- Reading a single point as a verdict. The most common interpretation error isn’t measurement at all—it’s panic over one number. Growth is a trajectory. A baby steadily tracking the 15th percentile is healthier than one who tumbles from the 75th to the 40th between visits.
What to do with your child’s number
If your result lands between the 2.3rd and 84th percentile (−2 to +1 SD), your baby’s weight is proportional to their length—no action needed beyond routine visits. If it’s below the 2.3rd or above the 97.7th, bring the number to your pediatrician; a one-off reading below −2 or above +2 SD warrants a proper growth-chart review, not immediate alarm.
The single most useful thing you can do is measure the same way each time and watch the direction. Log length and weight at each visit, run all three percentiles, and look for consistency. A stable curve—even a low or high one—is reassuring; a crossing curve is the signal worth asking about. To track the age-based side alongside proportion, our baby growth calculator plots weight, length, and head circumference together over time.
References and sources
- World Health Organization. Weight-for-length/height — WHO Child Growth Standards.
- Grummer-Strawn LM, Reinold C, Krebs NF. Use of World Health Organization and CDC Growth Charts for Children Aged 0–59 Months in the United States. MMWR Recomm Rep. 2010.
- Cole TJ, Green PJ. Smoothing reference centile curves: the LMS method and penalized likelihood. Stat Med. 1992;11(10):1305–1319.

Written by Jurica Šinko
Founder & CEO
Entrepreneur and health information advocate, passionate about making health calculations accessible to everyone through intuitive digital tools.
View full profileFrequently Asked Questions
What is a normal weight-for-length percentile for a baby?
Any percentile between the 2.3rd and 84th (−2 to +1 SD on the WHO chart) is considered normal weight-for-length. A baby steadily tracking the 15th percentile is just as healthy as one at the 75th — proportion and a stable trend matter more than a high number.
What is the difference between weight-for-length and weight-for-age?
Weight-for-age compares a baby’s weight to other babies the same age, while weight-for-length ignores age and compares weight to other babies the same length. A tall baby can be 90th for weight-for-age but 40th for weight-for-length — heavy only because they are long, not because they carry extra weight.
Should I use WHO or CDC charts for weight-for-length under age 2?
Use WHO. The CDC recommends the WHO growth standards for all children from birth to 24 months because they show how breastfed, well-nourished children should grow. The older CDC charts run heavier and can make a thriving breastfed baby look like they are falling behind after 3 months.
What weight-for-length percentile is considered overweight?
On the WHO chart, above the 97.7th percentile (+2 SD) is classified as overweight, and above 99.9th (+3 SD) as obese. A softer warning line sits at +1 SD (the 84th percentile) for "possible risk of overweight" — worth watching the trend, but not a diagnosis on its own.
Why is my baby a different percentile for weight-for-length than weight-for-age?
Because the two charts ask different questions. If your baby is shorter than average, their weight-for-length percentile will be higher than weight-for-age (weight looks bigger relative to a short length). If they are longer than average, the reverse happens. Both being normal is the reassuring case.
Do I measure length lying down or standing for this calculator?
Lying down (recumbent length). Babies under 2 are always measured flat on a length board. A child measured standing reads about 0.5–1 cm shorter, which would wrongly inflate the weight-for-length percentile. Once a child is measured standing, switch to a BMI-for-age percentile instead.
What does a weight-for-length z-score of −2 mean?
A z-score of −2 sits at about the 2.3rd percentile and is the WHO cutoff for "wasted" — weight is low relative to length. Below −3 is "severely wasted." A single reading at or below −2 SD warrants a growth-chart review with your pediatrician, not immediate alarm.
Related Calculators
Apgar Score Calculator — Newborn Health at 1 & 5 Minutes
Use the Apgar score calculator to rate a newborn at 1 and 5 minutes across heart rate, breathing, muscle tone, reflexes, and skin color on a 0 to 10 scale.

Baby Food Calculator — Solids Introduction & Portions
Estimate age‑appropriate portions and plan meal frequency with the baby food calculator. Log new foods, track allergens, and export a simple weekly menu.

Infant Growth Chart Calculator
Track weight, length, and head size with the infant growth chart calculator using WHO percentiles. See trends on clear charts and compare age-based progress.

Baby Length Percentile Calculator — WHO Reference Guide
Check WHO length‑for‑age percentiles with the baby length percentile calculator. Input age, sex, and length to see your percentile and track growth trends.

Baby Milestone Calculator — Track Skills by Age & Stage
Use our baby milestone calculator to see what’s typical by corrected age. Explore early, typical, and later windows for motor, language, and cognitive skills.

Baby Weight Percentile Calculator — WHO Growth Guide
Use the baby weight percentile calculator to see WHO weight‑for‑age percentiles. Enter age, sex, and weight to get your percentile, z‑score, and tips.