Use the Corrected Phenytoin Calculator
Free corrected phenytoin calculator using the Sheiner-Tozer equation to adjust a low phenytoin level for albumin or renal failure and estimate free drug.
Corrected phenytoin
12.5 mg/L
Unit System
mg/L and mcg/mL are the same number — US labs report phenytoin as one or the other.
The trough total level from the lab report — not a free (unbound) phenytoin result.
Drawn at or near the same time as the phenytoin level, or the correction is not valid.
Classic Winter-Tozer. Correction factor = 0.2 × albumin + 0.1, scaled so an albumin of 4.5 g/dL needs no correction at all.
Corrected (Albumin-Normalized) Phenytoin
Formula: 6.5 ÷ (0.2 × 2.1 + 0.1) = 6.5 ÷ 0.52 = 12.5 mg/L
The correction changes the interpretation
The reported level of 6.5 mg/L reads as subtherapeutic, but adjusted for an albumin of 2.1 g/dL the equivalent level is 12.5 mg/L — therapeutic. A dose change driven by the uncorrected number would be aimed at the wrong target.
Measured total
6.5mg/L
Correction factor
0.52
Multiplier
×1.92
Adjustment
+6mg/L
Est. free phenytoin
1.3mg/L
Est. free fraction
19.2%
Estimated Free (Unbound) Phenytoin
Target free range: 1–2 mg/L, about 10% of the 10–20 mg/L total range. A directly measured free level always outranks this estimate.
Your Numbers Through Each Published Equation
| Equation | Coefficient | Corrected | Band |
|---|---|---|---|
| Winter-Tozer (standard) | 0.2 | 12.5 mg/L | Therapeutic |
| Revised (0.25) | 0.25 | 10.4 mg/L | Therapeutic |
| Renal failure variant | 0.1 | 21 mg/L | Above range |
The spread across these rows is how much the published equations disagree at your albumin. It widens as albumin falls.
Total Phenytoin Reference Bands (Adults)
| Band | Total level | Typical finding |
|---|---|---|
| Subtherapeutic | Under 10 mg/L | Seizure breakthrough risk rises |
| Therapeutic | 10 – 20 mg/L | Standard adult target range |
| Above range | 20 – 30 mg/L | Nystagmus typically appears near 20 |
| Toxic range | Over 30 mg/L | Ataxia above 30, lethargy above 40 |
The highlighted row reflects the corrected value. Free-level targets are 1–2 mg/L. Always compare against your own laboratory's reference interval.
Disclaimer
This corrected phenytoin calculator is an educational estimate and does not replace clinical judgment or a directly measured free phenytoin concentration. The equation is not validated in pregnancy, in neonates, or during concurrent valproate therapy, and it assumes a steady-state trough drawn with a same-day albumin. Never adjust an antiepileptic dose without the supervision of the prescribing clinician.
Educational tool, not medical advice. Check this tool’s method and limitations before interpreting a result. Talk to a qualified healthcare professional before making decisions about medication, diet, exercise, or treatment. See our Terms of Use.
Your rating helps improve Corrected Phenytoin Calculator. We store only an anonymized vote (no personal data).
How to Use Corrected Phenytoin Calculator
Step 1: Choose your unit system
Select US (mg/L for phenytoin, g/dL for albumin) or SI (micromol/L and g/L). Note that mg/L and mcg/mL are the same number, so no conversion is needed between those two.
Step 2: Enter the measured total phenytoin
Type the trough total phenytoin concentration from the lab report into the Measured Total Phenytoin field. Do not enter a free or unbound phenytoin result here, because that value is already corrected.
Step 3: Enter the serum albumin
Enter the albumin drawn at or near the same time as the phenytoin level in the Serum Albumin field. An albumin more than 48 hours old can shift the corrected result by 15 to 20 percent.
Step 4: Select the renal function and equation variant
Pick Standard for a creatinine clearance of 20 mL/min or higher, Renal failure for a clearance under 10 mL/min or dialysis, or the revised 0.25 coefficient for neurocritical care patients.
Step 5: Read the corrected level and reclassification alert
The corrected phenytoin level appears instantly with a therapeutic band badge. The alert below it tells you whether the correction moved the result into a different band than the reported value.
Step 6: Compare the equations and check the free estimate
Review the comparison table to see how all three published equations score the same inputs, then check the estimated free phenytoin against the 1 to 2 mg/L target before any dose decision.
Key Features
- Sheiner-Tozer correction with standard (0.2), revised (0.25), and renal-failure (0.1) coefficients
- Side-by-side table showing how all three published equations score the same inputs
- Estimated free phenytoin concentration and unbound fraction against the 1-2 mg/L target
- Alert when the correction moves the result into a different therapeutic band
- Dual-marker range bar plotting the measured and corrected levels together
- US (mg/L, g/dL) and SI (micromol/L, g/L) unit support
Understanding Results
Formula
The Sheiner-Tozer equation divides the measured total phenytoin by a correction factor built from serum albumin. The factor estimates how much of a healthy adult's albumin binding capacity remains, so a factor of 0.52 means only 52% of normal binding is available and the reported total understates true drug exposure by roughly half.
Standard (CrCl 20 mL/min or higher): Corrected = Measured Total ÷ (0.2 × Albumin + 0.1)
Renal failure (CrCl under 10 mL/min): Corrected = Measured Total ÷ (0.1 × Albumin + 0.1)
Free estimate: Free phenytoin ≈ 0.1 × Corrected
Albumin is entered in g/dL and phenytoin in mg/L (identical to mcg/mL). The coefficients are deliberately scaled: 0.2 × 4.5 + 0.1 equals exactly 1.0, so a patient with a normal albumin of 4.5 g/dL receives no adjustment. The trailing 0.1 represents residual binding to plasma proteins other than albumin and keeps the denominator from collapsing toward zero at extreme hypoalbuminemia.
Reference Ranges & Interpretation
The adult therapeutic range for total phenytoin is 10–20 mg/L (40–79 µmol/L), and for free phenytoin 1–2 mg/L. Compare the corrected value against those bands, not the reported one. Concentration-related effects follow a predictable sequence: horizontal nystagmus near 20 mg/L, ataxia and slurred speech above 30 mg/L, and lethargy or encephalopathy above 40 mg/L.
The single most useful output is the reclassification alert. When a reported 6.5 mg/L at an albumin of 2.1 g/dL corrects to 12.5 mg/L, the result crosses from subtherapeutic into therapeutic, and the appropriate action flips from loading the patient to leaving the dose alone. Because phenytoin follows saturable Michaelis-Menten kinetics inside the therapeutic range, a modest dose increase applied to a misread level can produce a disproportionately large rise in serum concentration.
Assumptions & Limitations
The equation assumes a steady-state trough total phenytoin drawn with a same-day albumin, normal albumin binding affinity, and no competing highly protein-bound drugs. Allow 5–7 days after any dose change before treating a level as steady state.
It is not valid with concurrent valproate, which displaces phenytoin from albumin and raises the free fraction to 20–30% while albumin still reads normal. It has not been validated in pregnancy, in neonates, or at albumin values below about 1.5 g/dL, where the constant term dominates. A directly measured free phenytoin concentration by ultrafiltration outperforms this estimate and should be ordered whenever renal failure is present, an interacting drug is on board, the corrected value sits close to a decision threshold, or the clinical picture and the number disagree. Never adjust an antiepileptic regimen without the prescribing clinician.
Complete Guide: Corrected Phenytoin Calculator
On this page
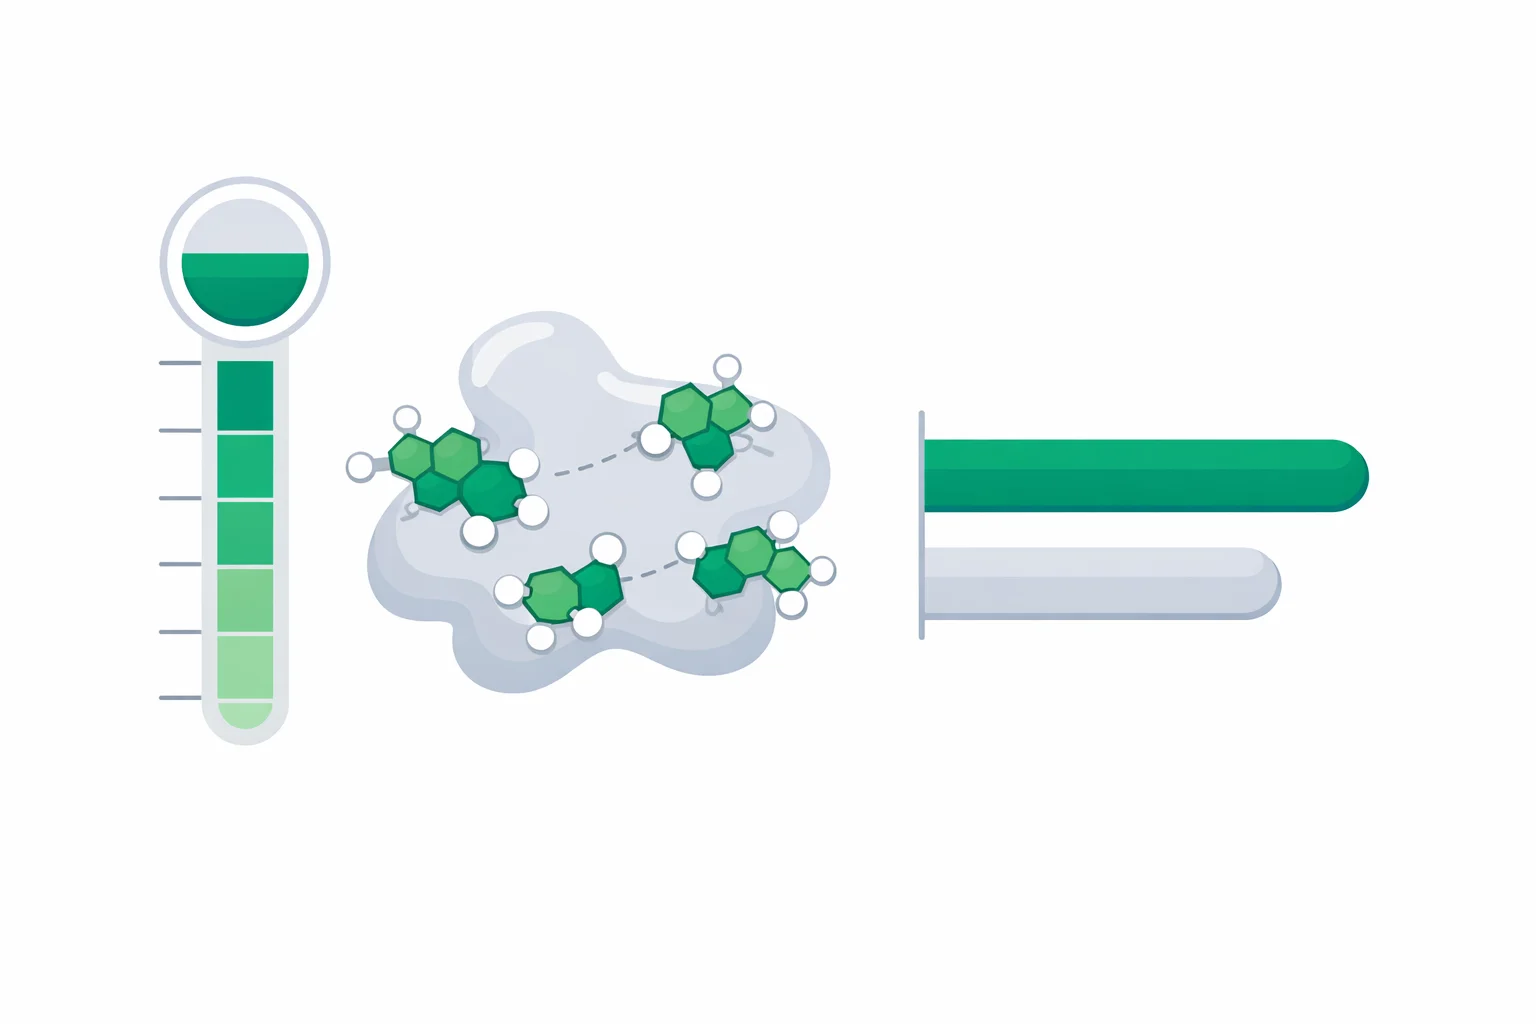
A corrected phenytoin calculator exists because roughly 90% of phenytoin in the bloodstream is bound to albumin, and only the remaining 10% crosses into the brain to stop seizures. Drop albumin from 4.5 g/dL to 2.1 g/dL and the total level a lab reports can fall by nearly half while the pharmacologically active free drug has not moved at all. That is the trap: a patient in the intensive care unit with a reported level of 6.5 mg/L looks badly subtherapeutic, gets a loading dose, and ends up genuinely toxic within 48 hours.
The Sheiner-Tozer equation — usually called Winter-Tozer in pharmacy practice — converts that misleading total into the level you would have seen if albumin were normal. What most references gloss over is that there is not one equation. There are at least three in active clinical use, they disagree with each other by 40% or more at low albumin, and picking the wrong one is its own dosing error. This guide compares them directly.
Three equations, three different answers
Every version shares the same skeleton: divide the measured total level by a correction factor built from albumin. Only the binding coefficient changes, and that single number carries all the disagreement.
| Equation | Denominator | No correction at | Intended population |
|---|---|---|---|
| Winter-Tozer (standard) | 0.2 × Alb + 0.1 | 4.5 g/dL | Adults, CrCl 20 mL/min or higher |
| Revised coefficient | 0.25 × Alb + 0.1 | 3.6 g/dL | Neurocritical care inpatients |
| Renal failure variant | 0.1 × Alb + 0.1 | Never (always corrects) | CrCl under 10 mL/min, dialysis |
Run one patient through all three and the divergence is stark. At an albumin of 2.1 g/dL and a reported level of 6.5 mg/L, the standard equation returns 12.5 mg/L, the revised coefficient returns 10.4 mg/L, and the renal variant returns 21.0 mg/L. Those three numbers sit in three different clinical bands: comfortably therapeutic, barely therapeutic, and above range. The calculator above prints all three side by side for exactly this reason — the spread is information, not noise.
What the denominator is actually doing
The correction factor is an estimate of the fraction of normal binding capacity still available. Read it as a percentage. A factor of 0.52 means this patient retains 52% of the albumin binding a healthy adult would have, so the measured total under-represents the true drug exposure by roughly half.
Standard: Corrected = Measured Total ÷ (0.2 × Albumin g/dL + 0.1)
Renal failure: Corrected = Measured Total ÷ (0.1 × Albumin g/dL + 0.1)
Free estimate: Free phenytoin ≈ 0.1 × Corrected
The trailing + 0.1 is not decoration. It is the floor: even with albumin at zero, a residual 10% of binding is assumed to come from other plasma proteins, which keeps the equation from dividing by something near zero and producing an absurd number. That floor is also why the correction misbehaves below about 1.5 g/dL — the constant starts to dominate a shrinking albumin term, and the output becomes more arithmetic than physiology.
Notice the coefficients are scaled deliberately. Plug 4.5 g/dL into the standard equation: 0.2 × 4.5 + 0.1 = 1.0 exactly, so a patient with normal albumin gets no adjustment. The revised coefficient hits 1.0 at 3.6 g/dL instead, which is why it always returns a lower corrected value than the standard version for the same inputs.
Worked example: albumin 2.1 g/dL, level 6.5 mg/L
A 68-year-old admitted with aspiration pneumonia has been on phenytoin 300 mg daily for years. Trough total phenytoin comes back at 6.5 mg/L against a target of 10–20 mg/L. Albumin is 2.1 g/dL. Serum creatinine is normal.
- Pick the equation. Renal function is intact, so the standard coefficient of 0.2 applies.
- Build the correction factor. 0.2 × 2.1 = 0.42, plus 0.1 gives 0.52.
- Divide. 6.5 ÷ 0.52 = 12.5 mg/L corrected.
- Estimate the free level. 0.1 × 12.5 = 1.25 mg/L, sitting inside the 1–2 mg/L free target.
- Derive the free fraction. 1.25 ÷ 6.5 = 19.2% unbound, roughly double the normal 10%.
The reported 6.5 mg/L reads as subtherapeutic. The corrected 12.5 mg/L reads as therapeutic. That reclassification is the entire clinical payload: this patient does not need more phenytoin, and giving a 500 mg load here would push the free level toward 2 mg/L and beyond. Because phenytoin follows saturable Michaelis-Menten kinetics near therapeutic concentrations, a 30% dose increase in this range can produce a far larger jump in serum level than a proportional change would predict — there is very little forgiveness on the way up.
When to switch to the renal-failure variant
Uremia does something albumin concentration alone cannot capture. Retained organic acids compete for the same binding sites on albumin and structurally alter the protein, so a dialysis patient with a perfectly respectable albumin of 4.0 g/dL still runs a free fraction closer to 20–25% rather than 10%. The renal variant handles this by halving the coefficient to 0.1, which produces a 1.8–2.0× adjustment even at normal albumin.
The usual threshold is a creatinine clearance under 10 mL/min or any patient on hemodialysis, though many institutions apply it below 20 mL/min. If you are unsure which side of that line a patient falls on, calculate it rather than eyeball it — the creatinine clearance calculator uses the Cockcroft-Gault equation that these thresholds were originally defined against, while an eGFR calculator gives the body-surface-normalized figure used for CKD staging. They are not interchangeable at the extremes of body weight, and the phenytoin literature is written in creatinine clearance.
Corrected phenytoin calculator vs. a measured free level
A directly measured free phenytoin concentration beats any equation, and it is not close. Ultrafiltration assays measure the unbound fraction rather than inferring it, which matters because the correction carries a wide error margin: published comparisons find the Winter-Tozer estimate falls outside a clinically acceptable window of the measured free level in a substantial minority of critically ill patients. The equation is a screening tool, not a substitute.
So why is the correction still used daily? Turnaround and availability. Free phenytoin assays are sent out at many hospitals with a 24–72 hour result window, while total phenytoin and albumin come back the same morning. When a decision has to happen before rounds end, the corrected value is what exists. The practical rule most pharmacists apply: use the correction to decide whether the situation is ambiguous enough to justify ordering a free level, and order the free level whenever the corrected value sits within about 20% of a decision threshold, whenever there is renal failure, or whenever the clinical picture and the number disagree.
Valproate: the displacement the equation cannot fix
Valproic acid binds the same albumin sites as phenytoin and wins. Co-administration can push the phenytoin free fraction to 20–30% while albumin sits at a completely normal 4.2 g/dL — and because the equation only reads albumin concentration, it will report a correction factor of about 0.94 and tell you nothing is wrong. The displacement is invisible to the arithmetic.
The effect is also time-dependent, which makes it worse. Acute displacement raises free phenytoin sharply; over the following days, increased clearance of the newly unbound drug pulls the total level down while free concentrations settle somewhere above baseline. A total level checked a week into combination therapy can look low and stable while the free level is the one causing the patient's nystagmus. Any patient on both drugs needs a measured free level, full stop. The same logic applies to other highly protein-bound competitors, including warfarin, salicylates at anti-inflammatory doses, and ceftriaxone. When multiple interacting drugs are in play, a drug half-life calculator helps map how long each competitor stays at concentrations high enough to matter.
Four mistakes that break the correction
Correcting a free level. The equation takes a total phenytoin concentration as input. Feeding it a free level that is already unbound double-corrects and inflates the result by roughly tenfold. If the lab report says "phenytoin, free" or the value is under 3 mg/L in a treated adult, stop.
Using a stale albumin. Albumin has a half-life near 20 days in health but falls fast in acute illness through capillary leak and dilution. An albumin drawn five days before the phenytoin level can be 0.8 g/dL off, which at low albumin shifts the corrected result by 15–20%. Draw them together.
Correcting a non-trough sample. Phenytoin has a variable half-life of 12–36 hours that lengthens as concentrations rise. A level drawn two hours after an oral dose reflects absorption, not steady state, and no albumin correction rescues a badly timed sample. Wait for a true trough, and allow 5–7 days after a dose change before treating any level as steady state.
Applying it to fosphenytoin without conversion. Fosphenytoin is dosed in phenytoin equivalents and must be fully converted to phenytoin before a meaningful level exists, which takes about 15 minutes after an intravenous dose and longer intramuscularly. Sampling too early measures a prodrug that has not become the drug yet. The same discipline that applies to any weight-based regimen in a dosage calculator applies here: confirm which molecule the number describes before doing arithmetic on it.
One structural note worth carrying beyond phenytoin. This is the same reasoning a corrected calcium calculator applies to serum calcium, but the arithmetic runs in the opposite direction. Calcium correction adds a fixed amount per gram of missing albumin; phenytoin correction divides by a proportional binding factor. Substances that bind albumin proportionally scale; those measured as a pool with a bound compartment shift additively. Confusing the two produces answers that are not merely imprecise but wrong by a large factor.
References
- National Library of Medicine, StatPearls. Phenytoin: pharmacology, therapeutic monitoring, and toxicity.
- U.S. Food and Drug Administration. Dilantin (phenytoin sodium) prescribing information — protein binding, therapeutic range, and saturable kinetics.
- National Institute of Neurological Disorders and Stroke. Epilepsy and seizures information page.

Written by Jurica Šinko
Founder & CEO
Entrepreneur and health information advocate, passionate about making health calculations accessible to everyone through intuitive digital tools.
View full profileFrequently Asked Questions
Why is my phenytoin level low when the dose has not changed?
Falling albumin is the most common reason. About 90% of phenytoin circulates bound to albumin, and labs measure the total of bound plus unbound drug, so when albumin drops from 4.5 to 2.1 g/dL the reported total can fall by nearly half while the active free drug stays the same. A reported level of 6.5 mg/L at an albumin of 2.1 g/dL corrects to 12.5 mg/L, which is squarely therapeutic. Check albumin before assuming the dose is too low.
What albumin level makes a phenytoin correction worth doing?
Below 3.5 g/dL the correction starts to matter, and below 3.0 g/dL it is essential. At an albumin of 4.0 g/dL the standard equation returns a factor of 0.9, so the adjustment is only about 11% and rarely changes a decision. At 2.0 g/dL the factor is 0.5, doubling the result. Above 4.5 g/dL the standard equation applies no correction at all by design.
Is the Sheiner-Tozer equation the same as the Winter-Tozer equation?
Yes, the two names describe the same formula. Sheiner and Tozer published the protein-binding adjustment, and Winter later popularized it in clinical pharmacokinetics teaching, so pharmacy references usually say Winter-Tozer while pharmacology texts say Sheiner-Tozer. Both refer to dividing the measured total phenytoin by 0.2 times albumin plus 0.1.
Should I use 0.2 or 0.25 as the phenytoin binding coefficient?
Use 0.2 for general adult use, since that is the classic coefficient and it is scaled so an albumin of 4.5 g/dL requires no correction. The revised 0.25 coefficient was derived in neurocritical care patients and normalizes at an albumin of 3.6 g/dL, so it always returns a lower corrected value. At an albumin of 2.1 g/dL the two differ by about 2 mg/L, which is enough to move a borderline result across a decision threshold.
How do I correct a phenytoin level in a dialysis patient?
Use the renal-failure variant, which divides by 0.1 times albumin plus 0.1 rather than 0.2 times albumin plus 0.1. Uremic organic acids compete for the same albumin binding sites and chemically alter the protein, so a dialysis patient runs a free fraction near 20 to 25% instead of the usual 10% even with a normal albumin. The threshold is a creatinine clearance under 10 mL/min, though many institutions apply it below 20 mL/min.
What is a normal free phenytoin level?
The free phenytoin target is 1 to 2 mg/L, which is roughly 10% of the 10 to 20 mg/L total range. A free level above 2 mg/L predicts toxicity more reliably than any total level, and above 3 mg/L symptoms are common regardless of what the total reads. Free levels are measured by ultrafiltration and are more accurate than any calculated estimate.
Can I use the correction if the patient is also taking valproate?
No, the equation is not valid with concurrent valproate. Valproic acid displaces phenytoin from the same albumin sites and can raise the free fraction to 20 to 30% while albumin remains a normal 4.2 g/dL, so the formula reads a correction factor near 0.94 and reports that nothing is wrong. Order a measured free phenytoin level instead. The same caution applies to warfarin, high-dose salicylates, and ceftriaxone.
What phenytoin level causes nystagmus or ataxia?
Horizontal nystagmus typically appears as total levels approach 20 mg/L, ataxia and slurred speech around 30 mg/L, and lethargy or encephalopathy above 40 mg/L. These thresholds track the free concentration rather than the total, which is why a hypoalbuminemic patient can show clear nystagmus at a reported total of only 14 mg/L. Correct the level before dismissing symptoms as unrelated.
Related Calculators

Adjusted Body Weight Calculator — Dosing Weight (ABW)
Compute ABW for dosing with our adjusted body weight calculator, alongside IBW reference. Essential for accurate medication dosing, especially in obesity.

Alcohol Calculator: Drinks, Calories, Cost and BAC
Use our alcohol calculator to track standard drinks, alcohol calories, cost, and estimated BAC. Plan sessions, see time to sober, and make informed choices.

Alcohol Units Calculator UK — Weekly Tracking & Limits
Free alcohol units calculator for UK weekly tracking. Convert drinks to units, check against the 14-unit guideline, and see calories, standard drinks, and more.

BAC Calculator — Estimate Blood Alcohol Level by Drink
Use our BAC calculator to estimate blood alcohol levels from drinks, ABV, weight, sex, and hours. See limit markers, impairment ranges, and time to sober.

Caffeine Calculator: Daily Intake Tracker & Safe Limits
Use our caffeine calculator to total daily milligrams from coffee, tea, energy drinks, and custom doses, then check the running total against the 400 mg limit.
Carboplatin AUC Calculator — Calvert Formula Dosing
Free carboplatin AUC calculator using the Calvert formula to find chemotherapy dose in mg from target AUC, GFR, and Cockcroft-Gault creatinine clearance.