Use the Mid-Parental Height Calculator
Free mid-parental height calculator that predicts a child's adult height from the mother's and father's heights, with a target range in cm or feet and inches.
- Mother + Father average
- 172.5 cm
- Sex adjustment
- +6.5 cm
- Predicted adult height
- 179.0 cm
| Father | Mother | Predicted son |
|---|---|---|
| 170.0 cm | 158.0 cm | 170.5 cm |
| 175.0 cm | 162.0 cm | 175.0 cm |
| 180.0 cm | 165.0 cm | 179.0 cm |
| 183.0 cm | 168.0 cm | 182.0 cm |
| 188.0 cm | 172.0 cm | 186.5 cm |
This mid-parental height calculator is a genetic-potential estimate, not a guarantee. A child's actual adult height depends on nutrition, puberty timing, sleep, health conditions, and measurement accuracy of the parents. For growth concerns, share your child's growth chart with a pediatrician rather than relying on a single predicted number.
Educational tool, not medical advice. Check this tool’s method and limitations before interpreting a result. Talk to a qualified healthcare professional before making decisions about medication, diet, exercise, or treatment. See our Terms of Use.
Your rating helps improve Mid-Parental Height Calculator. We store only an anonymized vote (no personal data).
How to Use Mid-Parental Height Calculator
Step 1: Select the child's sex
Tap Boy or Girl. This sets whether 6.5 cm is added (boy) or subtracted (girl) from the parental average.
Step 2: Choose your units
Switch between centimeters and feet & inches. The calculator converts both parents automatically.
Step 3: Enter the mother's height
Type the biological mother's adult height. Use a measured value rather than a rounded estimate for accuracy.
Step 4: Enter the father's height
Type the biological father's adult height. Every 1 cm of parent error shifts the child's target by about 0.5 cm.
Step 5: Read the predicted height and range
See the predicted adult height, the ±8.5 cm target band, and the expected adult percentile, then copy the summary.
Key Features
- Tanner mid-parental height formula for boys and girls
- Target height range of ±8.5 cm (±3.3 in), the ~95% band
- Metric and imperial inputs (cm or feet & inches)
- Expected adult height percentile for context
- Side-by-side boy vs. girl prediction from the same parents
Understanding Results
Formula
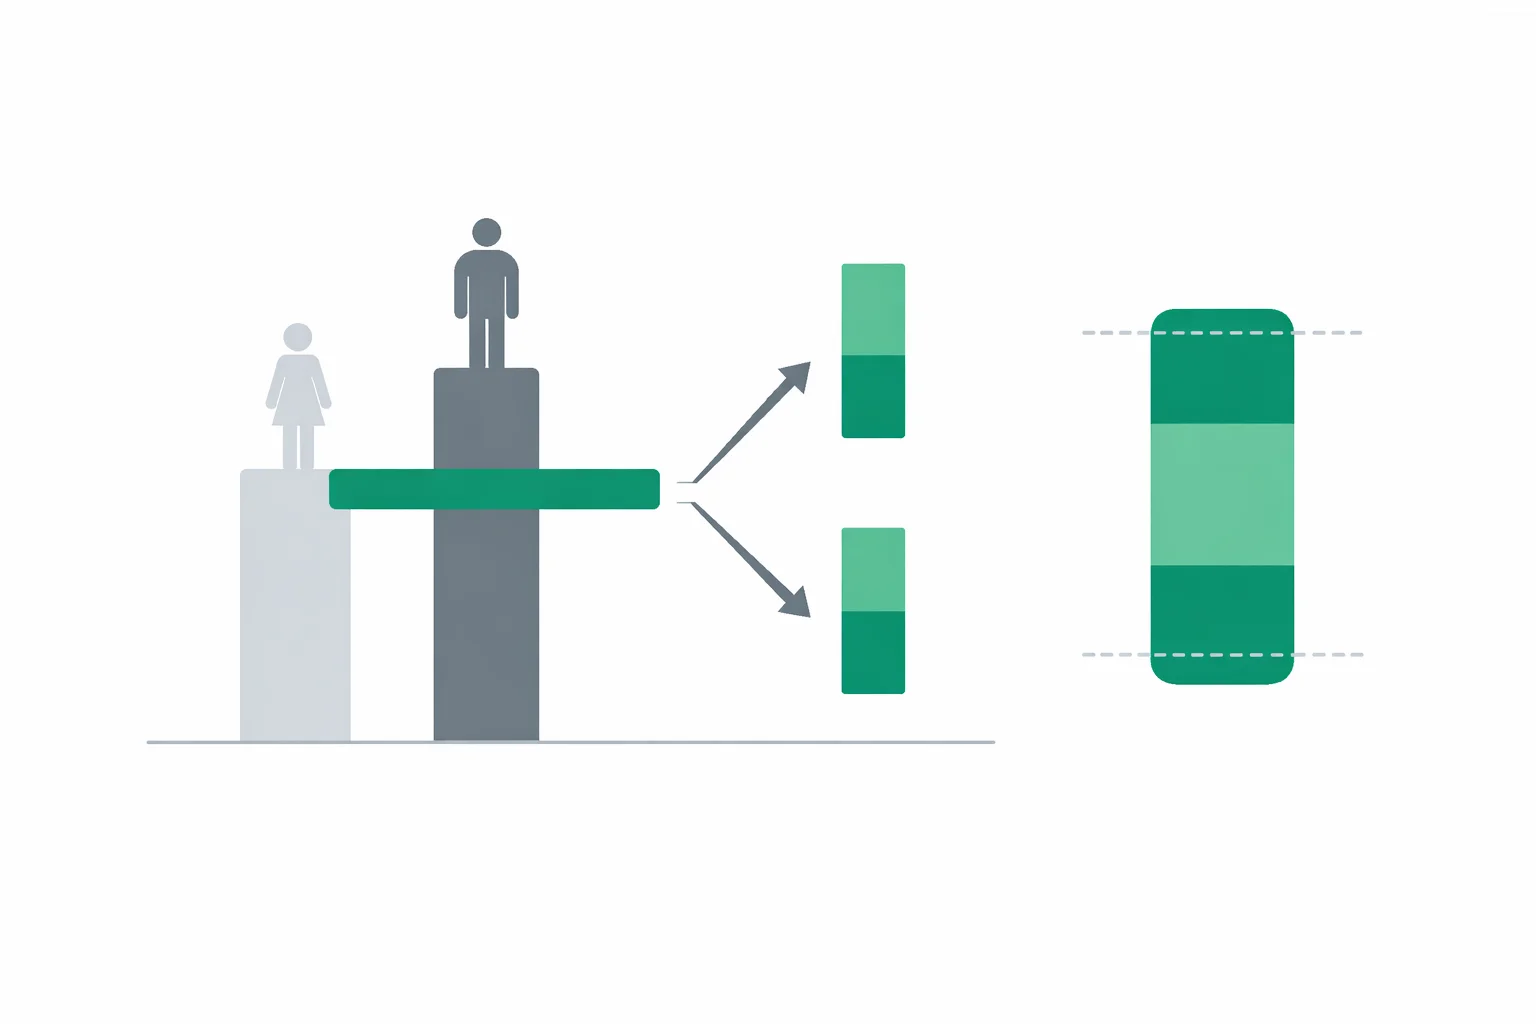
The calculator uses the Tanner mid-parental (target) height method. It averages both parents' heights, then applies a sex correction of half the ~13 cm adult male–female gap: boys = (father + mother + 13) ÷ 2 and girls = (father + mother − 13) ÷ 2, in centimeters. Equivalently, take the mid-parental average and add 6.5 cm (2.5 in) for a boy or subtract 6.5 cm for a girl. The expected adult percentile shown alongside the result compares the predicted height to U.S. adult population averages (men ~175.3 cm, women ~161.5 cm).
Reference Ranges & Interpretation
The predicted number is the center of a target band of about ±8.5 cm (±3.3 in) — roughly two standard deviations, which captures about 95% of children with a given parental average. A son of a 180 cm father and 165 cm mother has a target of 179 cm and a range of roughly 170.5–187.5 cm; the matching daughter targets 166 cm (157.5–174.5 cm). Read the child's own measured growth against CDC/WHO curves for context rather than expecting an exact final height.
Assumptions & Limitations
The method assumes two biological parents with accurately measured adult heights and ignores the child's own current stature, puberty timing, nutrition, and health. It is least reliable for children of very tall or very short parents (regression to the mean), after growth plates fuse, or when a parent's height is estimated. It is an educational genetic-potential guide, not a medical diagnosis — discuss growth concerns with a pediatrician.
Complete Guide: Mid-Parental Height Calculator
On this page
A mid-parental height calculator predicts a child's adult height from just two numbers: how tall the mother is and how tall the father is. It is the same shortcut pediatricians scribble in the margin of a growth chart. The method traces back to James Tanner, who noticed that a child's eventual stature clusters tightly around the average of both parents once you correct for the roughly 13 cm (about 5 inches) that separates the average adult man from the average adult woman. This guide walks through the exact formula, a step-by-step example, how far off the estimate can be, and how it stacks up against the more elaborate prediction methods clinicians use.
The mid-parental height formula
The mid-parental height formula has two versions that share one core step: average the parents, then shift the result by half of the male–female height gap. In centimeters:
- Boys: (father's height + mother's height + 13) ÷ 2
- Girls: (father's height + mother's height − 13) ÷ 2
An easier way to picture it: take the plain average of both parents (the mid-parental average), then add 6.5 cm for a boy or subtract 6.5 cm for a girl. The 6.5 cm is simply 13 ÷ 2. If you prefer inches, the gap is about 5 inches, so you add or subtract 2.5 inches instead. That single sex correction is why two siblings — one boy, one girl — born to the same parents have predicted adult heights about 13 cm apart, even though they share the same genes.
A worked example: 180 cm dad, 165 cm mom
Say the father is 180 cm (5′11″) and the mother is 165 cm (5′5″). First find the mid-parental average: (180 + 165) ÷ 2 = 172.5 cm. For a son, add 6.5 cm to get a target of 179 cm (5′10.5″). For a daughter, subtract 6.5 cm to get 166 cm (5′5.4″). The calculator above runs this instantly and also shows the ±8.5 cm target band: the son's 95% range is about 170.5–187.5 cm, and the daughter's is about 157.5–174.5 cm. Notice how wide that is — a full 17 cm from the bottom to the top of the range. That width is the honest part of the estimate, and it is the reason no calculator can promise a single exact number.
Why the answer is a range, not one number
The predicted adult height is a center point, but real children scatter around it. The standard target range is the mid-parental height plus or minus about 8.5 cm, which represents roughly two standard deviations — the band that captures about 95% of children with a given parental average. Put differently, if you lined up 20 children with identical parents, on average 19 would land inside the band and 1 would fall outside it. Height is polygenic (hundreds of genes contribute), so siblings vary; families also show regression to the mean, where children of very tall or very short parents tend to drift back toward the population average. The formula already builds in some of that pull, which is why a son of two 195 cm parents is predicted a bit shorter than both, not taller.
Mid-parental height vs. Khamis-Roche vs. bone age
Mid-parental height is the fastest method, but it ignores the child entirely — it only knows the parents. Two other methods add information about the specific child, which narrows the estimate. Here is how the three common approaches compare:
| Method | Inputs | Typical accuracy | Best for |
|---|---|---|---|
| Mid-parental height | Parent heights only | ±8.5 cm (95% band) | A quick genetic target at any age |
| Khamis-Roche | Child's age, height, weight + mid-parental height | ±5–6 cm | A no-x-ray estimate for a specific child |
| Bone age (Greulich-Pyle) | Hand X-ray + current height | ±3–5 cm | Clinical work-ups and puberty questions |
The takeaway: mid-parental height sets the genetic anchor, and the other methods refine it once a child is old enough to measure. If you want to layer a child's own measurements on top, our child height percentile calculator plots current height against CDC and WHO curves, which is the tracking step that pairs naturally with a target-height estimate. To fold that current-height percentile and the genetic target into a single forecast, our predicted adult height calculator does the blend for you.
What pushes a child above or below target
Genetics sets the target, but several forces move a child within — or outside — the predicted band:
- Puberty timing. Early puberty can make a child temporarily tall, then close the growth plates sooner, trimming final height by several centimeters. Late bloomers often catch up and can exceed a mid-cycle prediction.
- Nutrition. Chronic shortfalls in protein, calcium, vitamin D, or zinc suppress linear growth; the global secular trend of rising heights over the last century is largely a nutrition story.
- Sleep. Growth hormone peaks during deep sleep, so chronically short sleep in school-age children can blunt the growth curve.
- Health conditions. Thyroid disorders, growth hormone deficiency, celiac disease, and long-term corticosteroids can each pull a child below target, sometimes by 5–10 cm if untreated.
- The secular trend. Because each generation has trended taller, many children slightly out-grow a target built on their parents' heights — one reason the estimate skews conservative for tall-trending populations.
Common mistakes that skew the prediction
Small input errors move the answer more than people expect, because every centimeter of parent error transfers to half a centimeter of the child's target:
- Guessing parent heights. Self-reported heights average about 1–2 cm too tall. Two rounded-up parents can inflate a child's target by a full centimeter.
- Using the wrong sex. Selecting boy instead of girl shifts the target by 13 cm — the single biggest error you can make with this tool.
- Applying it after puberty. Once a teen's growth plates have fused, actual adult height already exists; a genetic target adds nothing. Measure the teen instead.
- Treating the center as a promise. The point estimate is the middle of a 17 cm-wide range. Reporting “5′10″” without the band overstates the precision.
When to use a mid-parental height calculator, and when to see a doctor
Use a mid-parental height estimate to set expectations before a child's own growth pattern is clear, to compare a toddler's current trajectory against family genetics, or simply to answer the “how tall will they be?” question at a family gathering. It pairs well with ongoing tracking: our boys growth chart calculator and girls growth chart calculator show whether a child is holding a steady percentile line as they grow. For a broader projection that also factors in the child's current stature, see the general height calculator.
Talk to a pediatrician if a child's measured height sits more than about 2 standard deviations below the mid-parental target, if they cross two or more major percentile lines downward, if growth velocity stalls for six months or more, or if height is far off from what family patterns predict. Bring the parents' heights and the child's growth chart — the mid-parental target is one of the first anchors a clinician checks before deciding whether further evaluation is warranted.
References
- Centers for Disease Control and Prevention. Clinical Growth Charts.
- MedlinePlus (U.S. National Library of Medicine). Growth chart and child development.

Written by Jurica Šinko
Founder & CEO
Entrepreneur and health information advocate, passionate about making health calculations accessible to everyone through intuitive digital tools.
View full profileFrequently Asked Questions
What is the mid-parental height formula?
Average both parents' heights, then add 6.5 cm (2.5 in) for a boy or subtract 6.5 cm for a girl. In centimeters: boys = (father + mother + 13) ÷ 2, girls = (father + mother − 13) ÷ 2. The 13 cm reflects the average adult male-female height difference.
How accurate is a mid-parental height prediction?
The estimate has a target range of about ±8.5 cm (±3.3 in), which is roughly two standard deviations. About 95% of children reach an adult height inside that band, so treat the central number as the middle of a 17 cm-wide window, not an exact figure.
Why do boys and girls get different predictions from the same parents?
Because the formula applies a sex correction. Boys get +6.5 cm and girls get −6.5 cm relative to the parental average, a 13 cm total gap. That is why a brother and sister with identical parents have predicted adult heights about 13 cm apart.
Can I predict my child's height if I only know one parent's height?
You can substitute the population-average height for the missing parent (about 175 cm for men, 162 cm for women), but the uncertainty grows because half the input is a guess. The ±8.5 cm range effectively widens, so interpret the result cautiously.
What is the difference between mid-parental height and the Khamis-Roche method?
Mid-parental height uses only the parents and is accurate to about ±8.5 cm. Khamis-Roche adds the child's current age, height, and weight, tightening accuracy to roughly ±5-6 cm without an X-ray. Bone-age methods are more precise still but require a hand radiograph.
Does an early growth spurt mean my child will end up tall?
Not necessarily. Early puberty can make a child temporarily tall for their age, but it also closes the growth plates sooner, which can trim final adult height by several centimeters. Late bloomers often catch up and may exceed a mid-cycle prediction.
My child is below the mid-parental target — should I worry?
A single measurement slightly below target is usually normal variation. Consider talking to a pediatrician if the child sits more than about 2 standard deviations below the target, crosses two major percentile lines downward, or stalls in growth for six months or more.
Related Calculators
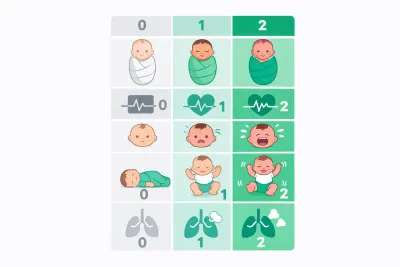
Apgar Score Calculator — Newborn Health at 1 & 5 Minutes
Use the Apgar score calculator to rate a newborn at 1 and 5 minutes across heart rate, breathing, muscle tone, reflexes, and skin color on a 0 to 10 scale.

Baby Food Calculator — Solids Introduction & Portions
Estimate age‑appropriate portions and plan meal frequency with the baby food calculator. Log new foods, track allergens, and export a simple weekly menu.

Infant Growth Chart Calculator
Track weight, length, and head size with the infant growth chart calculator using WHO percentiles. See trends on clear charts and compare age-based progress.

Baby Length Percentile Calculator — WHO Reference Guide
Check WHO length‑for‑age percentiles with the baby length percentile calculator. Input age, sex, and length to see your percentile and track growth trends.

Baby Milestone Calculator — Track Skills by Age & Stage
Use our baby milestone calculator to see what’s typical by corrected age. Explore early, typical, and later windows for motor, language, and cognitive skills.

Baby Weight Percentile Calculator — WHO Growth Guide
Use the baby weight percentile calculator to see WHO weight‑for‑age percentiles. Enter age, sex, and weight to get your percentile, z‑score, and tips.