Use the FTP Calculator
Free FTP calculator estimates your cycling functional threshold power from a 20-minute test and sets your training power zones in watts for structured rides.
FTP
266 W
Good
3.69 W/kg
Which test did you do?
The classic Coggan protocol. Warm up, blow the top end off with a 5-minute all-out effort, spin easy for 10 minutes, then ride 20 minutes as hard as you can hold.
Rider weight only — bike weight never enters W/kg. Use kit-on race weight for honest numbers.
Rider profile (adjusts the conversion factor)
The rider the standard 0.95 factor was built around. Pick this if unsure.
Sex (sets the W/kg benchmark table)
Benchmarks only. The FTP and zone maths are identical for everyone.
Functional threshold power
266 watts
280 W × 0.95 (20-min, all-rounder)
Power-to-weight
3.69 W/kg
Good · Cat 3Threshold zone (Z4)
242–279
watts · 91–105% FTP
Endurance zone (Z2)
149–199
watts · your all-day pace
VO2 max repeats (Z5)
282–319
watts · 3–8 min intervals
One hour at FTP
100 TSS
the anchor of the whole scale
Your power zones, 0 to 399 W
Coggan training zones at 266 W
| Zone | % FTP | Watts | TSS / hr | What it trains |
|---|---|---|---|---|
| Z1 Active recovery | <55 | <146 | 20 | Flushing the legs between hard days |
| Z2 Endurance | 56–75 | 149–199 | 43 | Fat oxidation, capillary and mitochondrial density |
| Z3 Tempo | 76–90 | 202–239 | 69 | Muscular endurance and sustained climbing pace |
| Z4 Threshold | 91–105 | 242–279 | 96 | Raising FTP itself — lactate clearance at the ceiling |
| Z5 VO2 max | 106–120 | 282–319 | 128 | Maximum oxygen uptake, 3-8 minute repeats |
| Z6 Anaerobic capacity | 121–150 | 322–399 | 184 | Attacks and 30-second to 3-minute efforts |
| Z7 Neuromuscular | >151 | >402 | — | Sprints under 15 seconds — power, not pacing |
TSS per hour is each zone's representative intensity squared, times 100 — so a full hour held exactly at FTP scores 100 by definition, and an hour of zone 2 endurance banks 43 points for a fraction of the recovery cost.
What you should be able to average — all-rounder power-duration curve
| Duration | % of FTP | Watts | W/kg |
|---|---|---|---|
| 5 min | 120% | 319 | 4.43 |
| 8 min | 111% | 295 | 4.10 |
| 12 min | 108% | 286 | 3.97 |
| 20 min — your test | 105% | 280 | 3.89 |
| 30 min | 102% | 272 | 3.77 |
| 40 min | 101% | 269 | 3.73 |
| 60 min | 100% | 266 | 3.69 |
| 90 min | 95% | 253 | 3.52 |
Compare these against your own bests. If your real 5-minute power sits well above this row, you are more fast-twitch than the profile assumes and your true FTP is lower than the flat 0.95 suggests.
Pacing your next test
- Hold today's FTP: average 280 W
- Gain 3%: average 288 W (274 W FTP)
- Gain 5%: average 294 W (279 W FTP)
Cap the opening minute at roughly 294 W. Riders who start 10% over target bleed watts for the rest of the effort and usually finish below an even pace.
Weekly load at this FTP
- A 2-hour zone 2 ride: 86 TSS
- 4 × 8 min at threshold plus a 90-minute base: ~133 TSS
- To gain fitness, most riders build toward 350–600 TSS a week before adding intensity.
Every one of these numbers moves the moment your FTP does, which is why retesting every 6–8 weeks matters more than squeezing the last watt out of a single test.
Threshold W/kg benchmarks — men
| Level | Typical racing | W/kg at FTP | Watts at 72 kg |
|---|---|---|---|
| World class | International pro | 6.60+ | 475 |
| Exceptional | Domestic pro | 5.69+ | 410 |
| Excellent | Cat 1 | 4.99+ | 359 |
| Very good | Cat 2 | 4.32+ | 311 |
| Good | Cat 3 | 3.65+ | 263 |
| Moderate | Cat 4 | 2.98+ | 215 |
| Fair | Cat 5 | 2.31+ | 166 |
| Untrained | Recreational | <2.31 | — |
Anchors from the Coggan power profile. W/kg decides climbs; raw watts decide flat roads and time trials, so a heavy rider can be slower uphill and faster on the level at the identical FTP.
Zones follow the Coggan seven-level model; conversion factors are estimates and every FTP test is a maximal effort. If you have a cardiac or respiratory condition, are new to hard training, or are returning from illness, get medical clearance before testing. This tool is for general information, not medical advice.
Educational tool, not medical advice. Check this tool’s method and limitations before interpreting a result. Talk to a qualified healthcare professional before making decisions about medication, diet, exercise, or treatment. See our Terms of Use.
Your rating helps improve FTP Calculator. We store only an anonymized vote (no personal data).
How to Use FTP Calculator
Step 1: Pick the test you actually did
Tap 20-minute test, 8-minute test, Ramp test, 60-minute TT, or "I know my FTP". Each protocol takes a different conversion factor, so choosing the wrong one shifts every zone. The 20-minute test is the default because it is the protocol Coggan built the 0.95 factor around.
Step 2: Enter the average power from that effort
For the 20-minute test, enter the average watts for the full 20 minutes. For the 8-minute test, average both efforts rather than taking the better one. For a ramp test, enter your best 1-minute power, which is usually the final minute plus part of the one before it.
Step 3: Add your body weight and switch units if needed
Type your rider weight into the Body weight field and use the kg / lb toggle beside the label. Bike weight is never part of W/kg. Weight only affects the power-to-weight figure and the benchmark table, not the FTP itself.
Step 4: Set your rider profile
Choose Diesel, All-rounder, or Fast-twitch. If you are unsure, divide your best 5-minute power by your current FTP: under 1.15 is Diesel, 1.15 to 1.25 is All-rounder, above 1.25 is Fast-twitch. The profile adjusts the conversion factor and reshapes the power-duration table.
Step 5: Read your FTP, W/kg, and the seven power zones
The green panel shows FTP in watts, your W/kg, and the Coggan racing band it lands in. Below it, the zone bar and the zones table give the watt range, the percentage range, and the TSS per hour for every zone from active recovery to neuromuscular.
Step 6: Sanity-check the result and plan the next test
Compare the power-duration table against your own bests: if your real 5-minute power sits well above the predicted row, switch to the Fast-twitch profile. Then use the pacing card for the average watts you need to hold, gain 3%, or gain 5% on the next test, and hit Copy zones to save the whole summary.
Key Features
- Five test protocols: 20-minute, 8-minute, ramp, full 60-minute TT, or a known FTP entered directly
- Rider-profile correction that replaces the flat 0.95 factor for diesel and fast-twitch riders
- All seven Coggan power zones in watts, with a colour-coded zone bar and TSS per hour for each
- Power-duration targets from 5 to 90 minutes so you can sanity-check the result against your own bests
- Power-to-weight in W/kg scored against the Coggan racing-category benchmarks for men and women
- Next-test pacing card with the average watts needed to hold, gain 3%, or gain 5%
Understanding Results
Formula
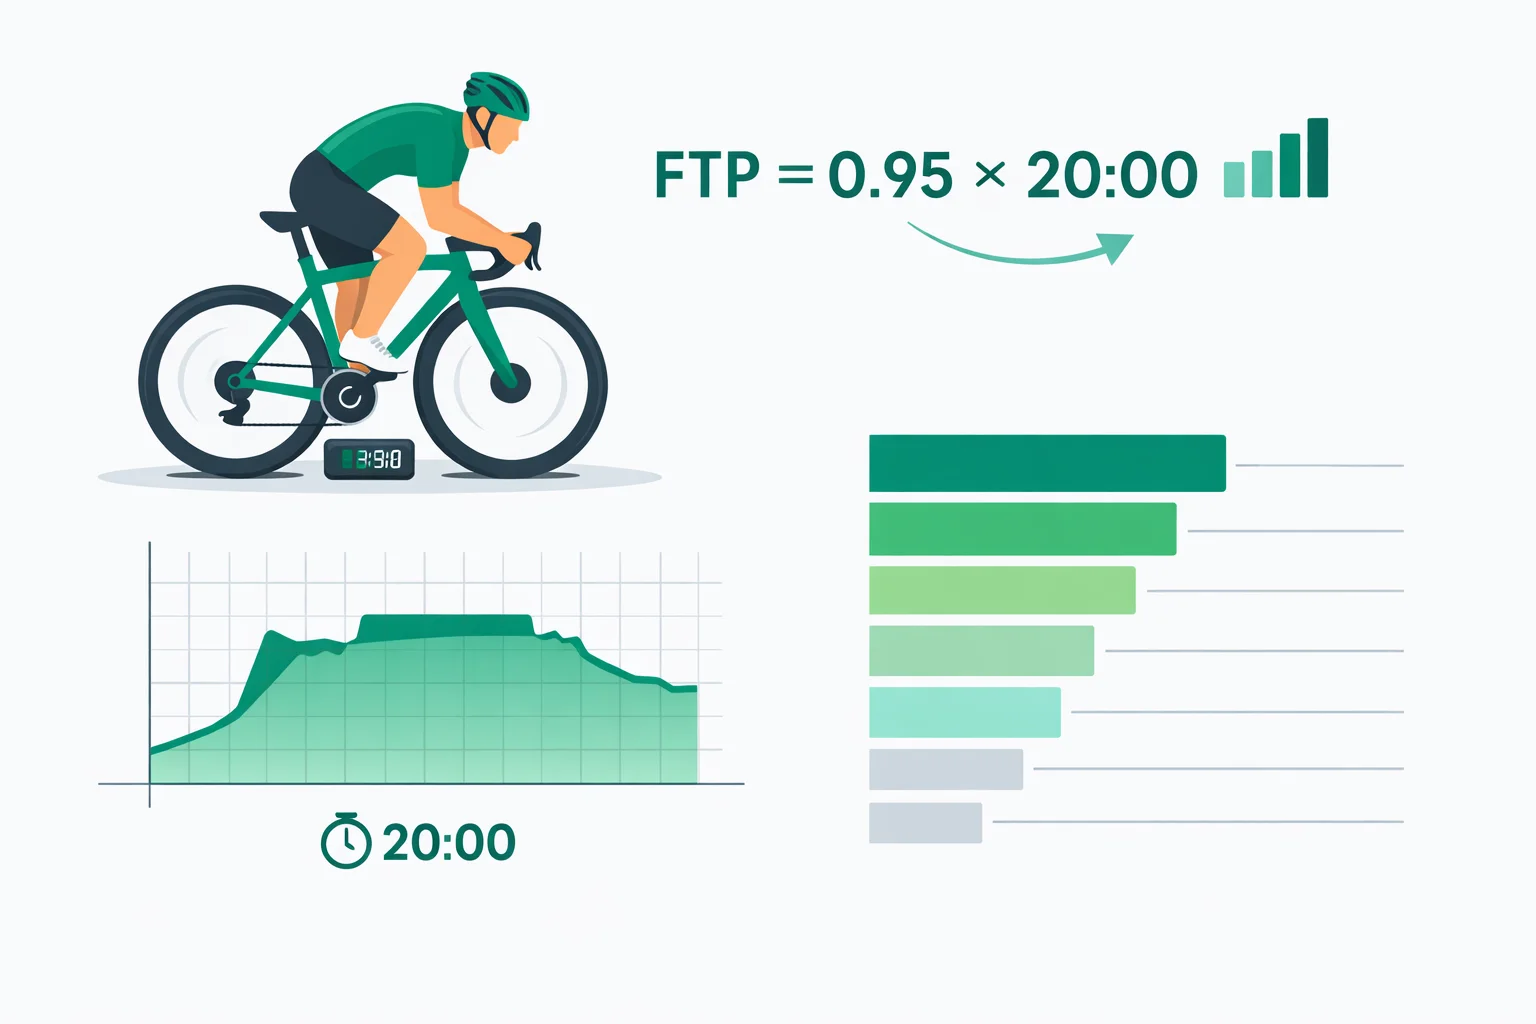
Functional threshold power is the highest average power you can hold in a quasi-steady state for approximately one hour. Every field test estimates that hour from a shorter effort by applying a correction factor:
FTP = test power × conversion factor
- 20-minute test: × 0.95 — because 20-minute power runs about 5% above 60-minute power.
- 8-minute test: × 0.90 — a shorter effort sits further above threshold, so it is discounted harder.
- Ramp test: × 0.75 of your best 1-minute power at the point of failure.
- 60-minute time trial: × 1.00 — this is the definition, so nothing is corrected.
This calculator derives all of those factors from one internally consistent power-duration curve rather than treating them as unrelated constants, and it shifts the curve by rider profile. A diesel rider fades little from 20 to 60 minutes, so their 20-minute factor rises to 0.97; a fast-twitch rider fades hard, so theirs drops to 0.93. On a 280-watt test that is the difference between a 270 W and a 260 W FTP.
Two figures are derived from the result. Power-to-weight is FTP divided by rider mass in kilograms — 266 W at 72 kg is 3.69 W/kg. Training Stress Score per hour is the intensity factor squared times 100, where intensity factor is the ratio of your ride power to FTP. That square is why one hour held exactly at FTP scores 100 TSS by definition, while an hour of zone 2 at 65% of FTP scores only 43.
Reference Ranges & Interpretation
The seven-level Coggan model splits training intensity by percentage of FTP. Each boundary marks a change in what the body is adapting to, not an arbitrary slice:
| Zone | % of FTP | TSS per hour | Typical interval |
|---|---|---|---|
| Z1 Active recovery | Under 55% | 20 | 30–60 min continuous |
| Z2 Endurance | 56–75% | 43 | 1–5 hours continuous |
| Z3 Tempo | 76–90% | 69 | 20–60 min blocks |
| Z4 Threshold | 91–105% | 96 | 2–3 × 15–20 min |
| Z5 VO2 max | 106–120% | 128 | 4–6 × 3–5 min |
| Z6 Anaerobic capacity | 121–150% | 184 | 30 s – 3 min |
| Z7 Neuromuscular | Above 150% | Not sustainable | Under 15 s |
For power-to-weight, the Coggan power-profile anchors for threshold run from 1.86 W/kg (untrained) through 2.98 (Cat 4), 3.65 (Cat 3), 4.32 (Cat 2) and 4.99 (Cat 1) to 6.6 W/kg at world-class level for men; the corresponding women's anchors are 1.26, 2.28, 2.90, 3.55, 4.17 and 5.69 W/kg. Most recreational riders who train consistently sit between 2.5 and 3.5 W/kg. Sources: the Coggan power profile reference tables and ACSM's Guidelines for Exercise Testing and Prescription.
Assumptions & Limitations
The conversion factors assume a maximal, evenly paced effort on a calibrated power meter. Pacing error is the largest source of noise in the whole calculation and it dwarfs the argument about the multiplier: going out 10% too hard and fading typically costs 8 watts on a 280-watt test, which propagates into every zone boundary and can overstate an eight-week training gain by 60%. A power meter that has not been zero-offset since the temperature changed adds another 1–2%.
FTP is a field proxy, not a physiological constant. Laboratory comparisons against maximal lactate steady state show a strong group-level correlation with limits of agreement wide enough to matter for an individual, and the 20-minute-derived value tends to sit above true steady state. Time to exhaustion at a correctly measured FTP ranges from about 30 to 70 minutes, so the “one hour” in the definition is an average rather than a promise. Indoor testing typically returns 5–10% lower values than outdoor because there is almost no convective cooling, so treat indoor and outdoor FTP as separate numbers rather than reconciling them.
The rider-profile adjustment is a structured estimate of your power-duration curve, not a measurement of it. If you have a full season of power data, a critical-power model fitted to your own bests will beat any fixed factor. Every FTP protocol is a maximal effort: anyone with a cardiac, respiratory or metabolic condition, anyone new to hard training, and anyone returning from illness should get medical clearance before testing, and should build the aerobic base with steady riding first.
Complete Guide: FTP Calculator
On this page
- Your 20-minute test, minute by minute
- Why every FTP calculator uses 0.95, and when it is wrong
- What eight watts of bad pacing cost you
- What do the seven power zones actually train?
- Ramp test vs. 20-minute test: which one lies to you?
- Can you really hold FTP for an hour?
- W/kg, raw watts, and the 4% gradient rule
- Why your indoor FTP is lower
Most riders open an FTP calculator with sweat still dripping onto the top tube, one number in their head: the average power from the 20 minutes they just survived. Say it read 280 watts. Multiply by 0.95, get 266, write it into Zwift, and every interval you ride for the next two months is scaled off that figure. It is a remarkable amount of weight to hang on a single decimal. This guide walks the whole thing through — the test, the multiplier, the zones it produces — and shows what changes when the test goes slightly wrong, because that is the part nobody checks.
Your 20-Minute Test, Minute by Minute
Functional threshold power is the highest average power you can hold in a quasi-steady state for about an hour. Hunter Allen and Andrew Coggan defined it that way in Training and Racing with a Power Meter, and then immediately conceded the obvious problem: almost nobody will do a 60-minute all-out effort, and the few who do will not repeat it every eight weeks. So the field test is 20 minutes, discounted. Here is the 20 minute FTP test as Coggan wrote it, and every stage has a job:
- 20 min easy, around 65% of your last FTP. Warm the legs without touching your glycogen.
- 3 × 1 min at 100–110 rpm, 1 min easy between. Opens the neuromuscular system.
- 5 min easy.
- 5 min all-out. This is the stage riders skip, and it is the most important one. It deliberately drains your anaerobic reserve so that the 20-minute effort is fuelled aerobically. Skip it and you carry a battery into the test that inflates the average.
- 10 min easy. Long enough to clear the worst of the fatigue, short enough that the battery does not recharge.
- 20 min time trial. Flat road, steady climb, or a trainer in erg-off mode. Even effort from the first pedal stroke.
- 10–15 min cool-down.
That 5-minute blowout is what separates a test from a hard ride. A rider with a large anaerobic capacity can add 15–20 watts to a fresh 20-minute effort purely from stored anaerobic work, and none of it is repeatable across an hour. Strip it out first and the number you record is closer to what your aerobic system can genuinely defend. If you have ever wondered why your outdoor FTP test read high and every threshold session afterwards felt impossible, this is usually the culprit.
Why Every FTP Calculator Uses 0.95, and When It Is Wrong
The 0.95 is not physiology. It is an observation about the shape of the human power-duration curve: for a typical trained cyclist, 20-minute power runs roughly 5% above 60-minute power. Invert it and the same claim reads more usefully — you can hold about 105% of FTP for 20 minutes. Coggan himself has said the real spread runs from about 0.93 to 0.97 depending on the rider, and where you sit in that range is decided by one thing: how much of your 20-minute effort came from anaerobic sources.
A pure time-triallist has a shallow curve. Their 5-minute power might be only 13% above threshold, their 20-minute power only 3.6% above, and 0.95 quietly robs them of watts. A track sprinter turned road rider has a steep curve — 5-minute power 28% above threshold — and 0.95 hands them an FTP they cannot defend for 40 minutes, let alone 60. Same test, same number on the screen, two different thresholds:
| 280 W for 20 minutes | Diesel | All-rounder | Fast-twitch |
|---|---|---|---|
| Conversion factor | 0.97 | 0.95 | 0.93 |
| Resulting FTP | 270 W | 266 W | 260 W |
| Zone 2 ceiling (75%) | 203 W | 200 W | 195 W |
| VO2 max interval target (110%) | 297 W | 293 W | 286 W |
Ten watts of FTP spread across the zones looks small on paper. In practice the fast-twitch rider assigned the all-rounder's 293-watt VO2 target is doing every interval seven watts too hard, and the first casualty is the fourth repeat. If you do not know which profile you are, there is a free diagnostic sitting in your ride history: pull your best 5-minute power and divide it by your FTP. Under 1.15 puts you in diesel territory, 1.15–1.25 is the all-rounder middle, and above 1.25 means the standard factor is overstating your threshold.
What Eight Watts of Bad Pacing Cost You
Everyone argues about the multiplier. Almost nobody audits the input, which is odd, because the input has far more error in it. The single most common mistake in a 20-minute test is going out too hard: the first two minutes feel controlled at 305 watts, the last eight are a slow bleed down to 262, and the average lands at 272 instead of the 280 an even pace would have produced.
Eight watts. Roughly 3% of the effort. Here is where that error goes once it has been through the multiplier and out into every zone boundary:
| Consequence | Even pace (280 W) | Fade (272 W) | Gap |
|---|---|---|---|
| FTP | 266 W | 258 W | 8 W |
| Sweet-spot session (4 × 12 min at 92%) | 245 W | 237 W | 8 W too easy |
| TSS for a 2-hour endurance ride | 84 | 89 | 6% inflated |
| Apparent gain after 8 weeks of real +5% progress | +13 W | +21 W | 60% overstated |
The bottom row is the one that actually hurts. If you pace the first test badly and the second one well, the block looks like it delivered a 21-watt gain when the physiology only moved 13. That flatters the training plan and buries the truth. The fix costs nothing: hold the opening minute no more than 5% above your target average, accept that minutes four through twelve will feel survivable rather than heroic, and spend whatever is left in the final two. An even-paced test that reads slightly low is worth more than a heroic one that reads high, because zones built on it are zones you can actually complete.
Two smaller input errors are worth naming. A power meter that has not been zero-offset since the temperature changed can drift by 1–2%, which is the same order as the pacing error. And testing on a day when you are carrying fatigue from a hard weekend does not produce a “conservative” FTP — it produces a wrong one, and every session for eight weeks inherits it.
What Do the Seven Power Zones Actually Train?
The zones the calculator prints are not arbitrary slices of a percentage bar. Each one sits on a different physiological adaptation, and the boundaries mark where the body switches strategy.
- Zone 2, 56–75%. Where mitochondrial density and capillarisation are built, and where fat oxidation peaks. Boring, and it is where most of the volume in a well-built plan lives. The upper edge sits near the first lactate turn point for most riders, which is why it maps closely onto a zone 2 heart rate calculator target.
- Zone 3, 76–90%. Tempo. Useful for muscular endurance and sustained climbing, and the zone riders drift into accidentally on group rides — hard enough to cost recovery, not hard enough to drive threshold adaptation.
- Zone 4, 91–105%. The one that moves FTP. Lactate production and clearance are balanced here, so the adaptation targeted is clearance capacity itself. Typical dose: 2–3 × 15–20 minutes.
- Zone 5, 106–120%. VO2 max work. Intervals of 3–8 minutes, because the goal is time spent near maximum oxygen uptake, not the wattage on the screen. If your fourth repeat collapses, the target was too high — see the profile discussion above.
- Zone 6, 121–150%. Anaerobic capacity. Thirty seconds to three minutes, the currency of attacks and short climbs.
- Zone 7, above 150%. Neuromuscular. Under 15 seconds, where power output is limited by force and coordination rather than by anything aerobic. Averages are meaningless here; only peaks matter.
The Training Stress Score column in the calculator is worth a second look, because it makes the cost of each zone explicit. TSS per hour is simply the intensity factor squared, times 100 — so an hour at FTP scores exactly 100, an hour in the middle of zone 2 scores 43, and an hour of threshold work at 98% scores 96. The square is the whole story: intensity is punished non-linearly, which is precisely why three hours of zone 2 costs less recovery than one hour at threshold despite banking more total work. If you are budgeting a week rather than a session, the training volume calculator is the better place to start.
Ramp Test vs. 20-Minute Test: Which One Lies to You?
Both. Differently. The ramp test — a staged climb to failure, with FTP set at 75% of your best 1-minute power — is popular because it takes about 20 minutes door to door, needs no pacing skill, and does not require you to be brave for a fixed block of time. Its flaw is structural: it reads a 1-minute peak, and 1-minute power is dominated by anaerobic capacity. Estimating an aerobic ceiling from an anaerobic measurement works fine for the average rider and fails predictably at the edges.
| Ramp test | 20-minute test | |
|---|---|---|
| Total time including warm-up | ~25 min | ~75 min |
| Pacing skill required | None | High |
| Biased high for | Sprinters, puncheurs | Anyone who skips the 5-min blowout |
| Biased low for | Time-triallists, ultra-endurance riders | Riders who fade in the last five minutes |
| Best used for | Frequent re-checks in a training block | Setting the zones you will actually train on |
The practical compromise most coached riders land on: set your zones with a 20-minute test at the start of a block, then use a ramp every three or four weeks to check the direction of travel. Do not mix them. A ramp FTP and a 20-minute FTP are two different measurements, and comparing one to the other across a training block is how riders convince themselves they have lost 15 watts in a fortnight. Whichever you pick, keep the protocol, the trainer, the fan, and the time of day constant — consistency of method beats accuracy of method when what you care about is the trend.
Can You Really Hold FTP for an Hour?
Probably not, and that is not a failure of your training. Time to exhaustion at a correctly measured FTP typically falls somewhere between 30 and 70 minutes depending on the rider, and the “one hour” in the definition is a convenient average rather than a promise. Well-trained endurance riders with high aerobic contribution sit at the top of that range; riders with big anaerobic capacity sit at the bottom, which is the same axis that decided their conversion factor.
The deeper issue is that FTP is a field proxy for something physiological that it does not quite equal. Laboratory work comparing FTP against maximal lactate steady state — the highest intensity at which blood lactate stabilises rather than climbing — finds a strong group-level correlation but limits of agreement wide enough to matter for an individual. Borszcz and colleagues found FTP derived from the 20-minute test tended to sit above MLSS, meaning a rider training at “95% of FTP” may in fact be working above their true steady state. If your threshold intervals consistently feel harder than the prescription implies, that is a plausible explanation and a good reason to shade the target down by 3–5% rather than assume you are undertrained.
None of this makes FTP useless. It makes it a reference point rather than a physiological constant. Its real value is that it is repeatable, cheap, and scales every other number in your training file. Treat it the way you would treat a VO2 max calculator estimate — directionally useful, precise to within a few percent, and far more informative as a series than as a single reading.
W/kg, Raw Watts, and the 4% Gradient Rule
Divide FTP by body mass in kilograms and you get the number that decides climbing. Our 266-watt rider at 72 kg makes 3.69 W/kg, which lands in the “good” band of the Coggan power profile, around the level of a competitive Cat 3 racer. Push to 4.32 W/kg and they are Cat 2 territory; 4.99 is Cat 1; the world-class anchor sits at 6.6 W/kg for men and 5.69 for women.
Which number matters depends entirely on the road. On flat ground almost all your power goes into pushing air, and aerodynamic drag scales with frontal area, not with mass — so raw watts win and the heavier rider is usually faster. On a steep climb most of your power goes into lifting your own mass, and W/kg wins. The crossover sits at roughly a 4% gradient: below it raw watts dominate, above it power-to-weight does, and a 90 kg rider at 320 W (3.56 W/kg) will beat a 60 kg rider at 230 W (3.83 W/kg) on the flat and lose to them badly on an alpine pass.
This is also where the most common self-inflicted mistake in cycling lives. W/kg has two terms, and cutting the denominator looks like the fast route. It works right up until it does not: aggressive weight loss during a training block reliably takes watts with it, and a rider who drops 4 kg while losing 20 watts has moved from 3.69 to 3.60 W/kg — worse on the climbs and meaningfully slower everywhere else. If you are going to touch the denominator, do it in a base period with a small deficit, and confirm with a TDEE calculator that you are actually fuelling the training you are still doing.
Why Your Indoor FTP Is Lower
A drop of 5–10% from outdoor to indoor testing is normal and mostly not about motivation. The dominant cause is thermal: without road speed there is almost no convective cooling, core temperature climbs, and cardiovascular drift shows up as a heart rate that keeps rising while power stays flat. Add the fixed position — no coasting, no standing, no changes in muscle recruitment — and the same wattage genuinely costs more.
Most of that gap is recoverable. A decent fan pointed at your chest and head is worth several watts on its own; two are better. Test at the same time of day, in the same room, with the same hydration routine, and treat indoor and outdoor FTP as two separate numbers rather than trying to reconcile them. Many riders keep both and use whichever matches where the session is happening.
One last thing worth internalising. FTP is a moving target — it drifts with heat acclimation, altitude, fatigue, illness and the point you are at in a training block. Retesting every six to eight weeks is enough; retesting monthly mostly measures noise and costs you a hard session each time. If you want a single habit to take away from this page, make it consistency of protocol. The absolute number matters far less than whether the number you get in October can be honestly compared with the one from August. And if power is your primary intensity signal, keep heart rate as a cross-check rather than a replacement — a heart rate zone calculator will tell you when the same watts are suddenly costing more, which is usually the first sign of fatigue or illness arriving.
References
- Allen H, Coggan A, McGregor S. Training and Racing with a Power Meter, 3rd edition. VeloPress, 2019 — source of the functional threshold power definition, the 20-minute protocol, and the seven-zone model.
- Borszcz FK, Tramontin AF, Bossi AH, Carminatti LJ, Costa VP. Functional threshold power in cyclists: validity of the concept and physiological responses. International Journal of Sports Medicine, 2018 — PubMed.
- Jeffries O, Simmons R, Patterson SD, Waldron M. Functional threshold power is not equivalent to lactate parameters in trained cyclists. Journal of Strength and Conditioning Research — PubMed.
- Coggan A. Power profiling and the Training Stress Score. TrainingPeaks — power profile W/kg reference tables.
- American College of Sports Medicine. ACSM's Guidelines for Exercise Testing and Prescription, 11th edition, 2021.

Written by Jurica Šinko
Founder & CEO
Entrepreneur and health information advocate, passionate about making health calculations accessible to everyone through intuitive digital tools.
View full profileFrequently Asked Questions
How do you calculate FTP from a 20 minute test?
Multiply your average power for the 20-minute effort by 0.95. Average 280 watts and your FTP is 266 W. The 0.95 exists because a trained cyclist can hold roughly 5% more power for 20 minutes than for a full hour, and FTP is defined at the hour. The factor is an approximation: Coggan puts the real range at 0.93 to 0.97 depending on how much anaerobic capacity a rider brings to the effort.
Is 250 watts a good FTP?
It depends almost entirely on your weight. At 90 kg, 250 W is 2.78 W/kg, which sits in the moderate band around Cat 4 level. At 65 kg the same 250 W is 3.85 W/kg, which is a competitive Cat 3 number. Raw watts only tell you how fast you will be on the flat, where drag rather than mass sets the pace, so always convert to W/kg before comparing yourself to anyone.
What is a good FTP in watts per kilogram?
Using the Coggan power profile anchors, a male rider clears 2.98 W/kg for moderate or Cat 4 level, 3.65 for good or Cat 3, 4.32 for very good or Cat 2, and 4.99 for excellent or Cat 1. World class sits at 6.6 W/kg. For women the equivalent anchors are 2.28, 2.90, 3.55, 4.17 and 5.69 W/kg. Most recreational cyclists who train consistently land between 2.5 and 3.5 W/kg.
Why is my ramp test FTP lower than my 20 minute FTP?
Because the two tests measure different things. A ramp test takes 75% of your best 1-minute power, and 1-minute power is driven mostly by anaerobic capacity, whereas the 20-minute test reads a largely aerobic effort. Riders with a strong sprint get flattered by the 20-minute protocol and cut down by the ramp; time-triallists see the opposite. Differences of 5 to 10% between the two are routine, so pick one protocol and stay with it rather than comparing across them.
What is the difference between FTP and lactate threshold?
FTP is a field estimate; lactate threshold is a laboratory measurement of the highest intensity at which blood lactate stabilises instead of climbing. They correlate strongly across a group of riders, but individual agreement is loose. Studies comparing the 20-minute-derived FTP against maximal lactate steady state have found FTP tends to sit above it, which is why threshold intervals prescribed at 95 to 105% of FTP can feel harder than the label suggests.
Can you actually ride at FTP for a full hour?
Most riders cannot. Time to exhaustion at a correctly measured FTP typically falls between 30 and 70 minutes, and the one-hour figure in the definition is an average rather than a guarantee. Aerobically dominant riders sit at the upper end of that spread and riders with large anaerobic capacity at the lower end. If you fail at 35 minutes your FTP is probably set a few watts high, not your fitness low.
How often should you retest FTP?
Every six to eight weeks, which is about the interval over which a training block produces a change big enough to separate from noise. Monthly testing mostly measures day-to-day variation and costs you a quality session each time. Expect roughly 5 to 10% gains per block for a first-year cyclist and 2 to 3% for someone with several seasons of structured training behind them.
Does the 5 minute all-out effort before the 20 minute test really matter?
Yes, and it is the stage riders most often skip. Its job is to drain your anaerobic reserve so the 20-minute effort runs on aerobic energy alone. A rider with a big anaerobic capacity who goes into the test fresh can add 15 to 20 watts that no hour-long effort could ever repeat, which inflates FTP and makes every threshold session afterwards feel impossible. Skip the blowout and you are measuring a hard ride, not a threshold.
Related Calculators

5K Pace Calculator — Splits, Finish Time & Pace Zones
Train smarter with the 5K pace calculator: convert goal time to precise per-km and per-mile pace and split targets. Get fast, accurate results instantly.

Agility Calculator for T‑Test and Pro Agility (5‑10‑5)
Use our agility calculator to time T‑Test and pro agility shuttles, compare attempts, track change‑of‑direction speed, check asymmetry, and monitor progress.
Speed, Agility & Power — Athletic Performance Calculator
Analyze running pace, race predictions, strength 1RM, and jump power in one athletic performance calculator. Mobile‑first with quick inputs and clear results.
Bench Press Calculator — 1RM, Strength Level & Training
Free bench press calculator to estimate your one-rep max (1RM), compare strength standards by body weight and sex, and get percentage-based training loads.

Bench Press Calculator — 1RM Max, Sets & Plate Math
Use our bench press calculator to estimate your 1RM from reps and weight, auto‑build working sets, warm‑up ladder, and plate math in kg/lb. Mobile‑friendly.
Body Recomposition Calculator — Recomp Fat Loss & Muscle
Free body recomposition calculator projects fat loss and muscle gain month by month from your calories, protein, body fat and training age. Plan a real recomp.