Child BMI Percentile: What the Number Actually Means
A BMI of 17.5 puts a 7-year-old just past the overweight cutoff and leaves a 13-year-old comfortably below average. Same number, opposite verdicts. Here is how BMI-for-age percentiles work, what the 85th and 95th lines actually mean, and which readings deserve a call to the pediatrician.
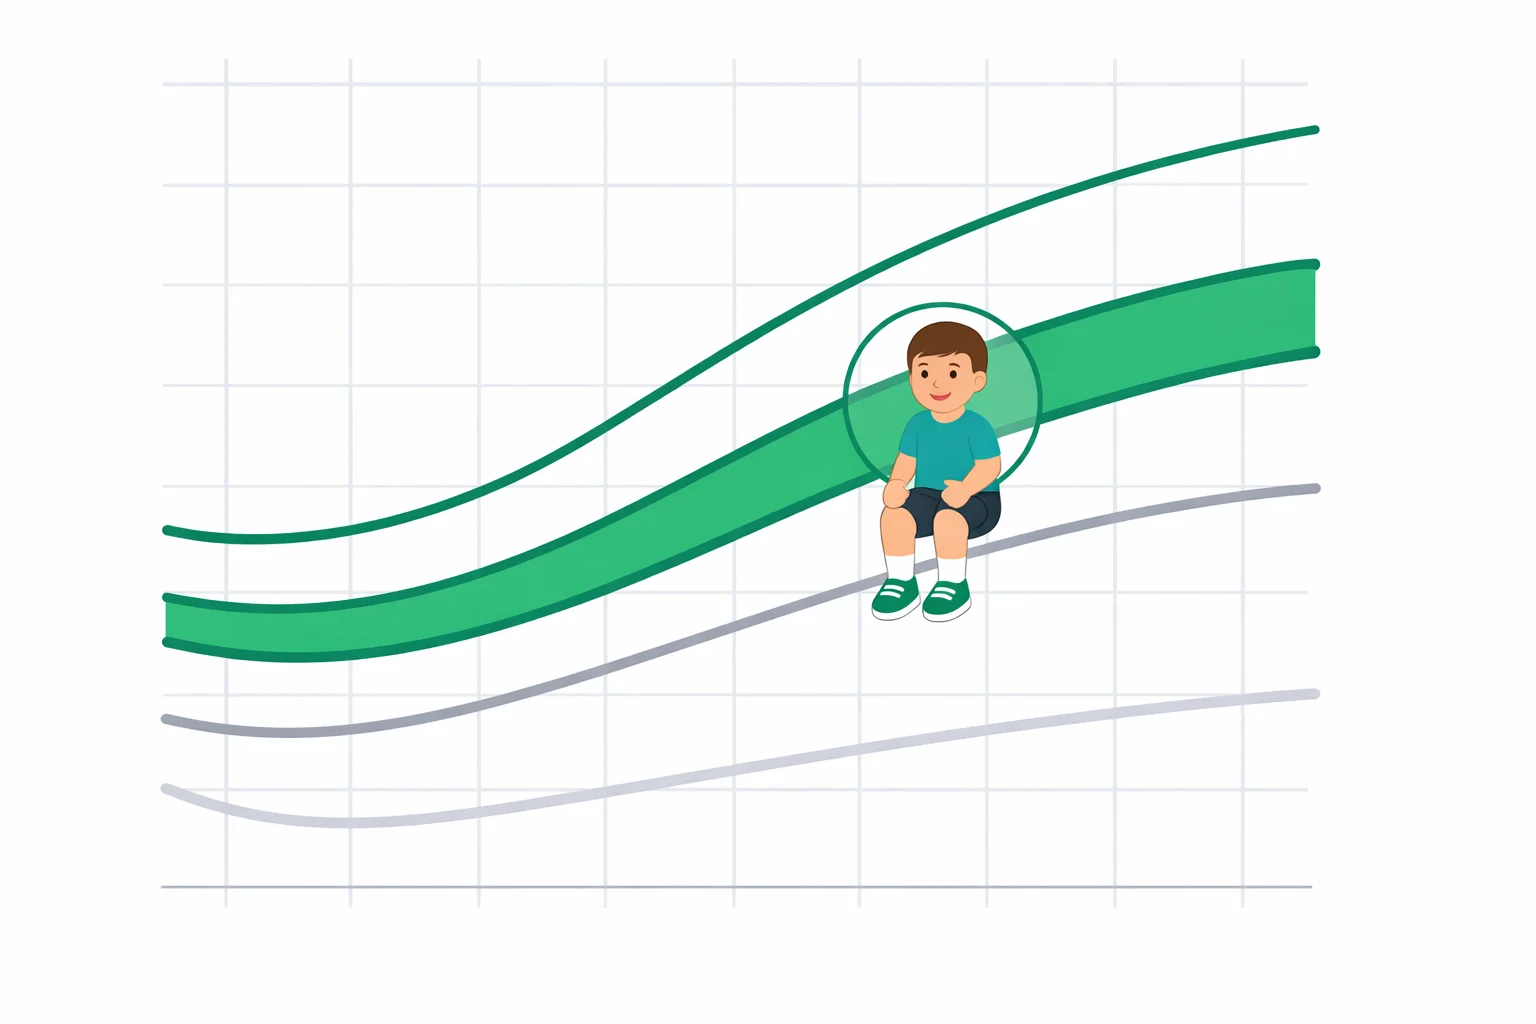
Two Children, One BMI of 17.5, Opposite Verdicts
A child BMI percentile is the only part of the calculation that carries any meaning, and the raw BMI on its own carries almost none. Take a 7-year-old boy who weighs 26 kg and stands 1.22 m tall. His BMI is 26 ÷ (1.22 × 1.22) = 17.5. On the CDC BMI-for-age curves that lands him just past the 85th percentile, which is the line where the label changes to overweight.
Now give the identical BMI of 17.5 to a 13-year-old boy. He sits just above the 25th percentile — leaner than average, nowhere near any flag. Nothing about the arithmetic changed. What changed is that the reference population grew up. Boys gain roughly 3.4 BMI units between their seventh and thirteenth birthdays purely from normal development, so a fixed number cannot mean a fixed thing.
That is the whole reason pediatric BMI is reported as a percentile instead of a category. If you already have your child's height, weight, and date of birth, the child BMI percentile calculator plots them against the correct age-and-sex curve. The rest of this article is about reading the number it gives you.
What a Child BMI Percentile Actually Ranks
The percentile answers one narrow question: out of 100 children of the same sex and the same age in months, how many had a lower BMI? A result of 62 means 62 of them did. It is a ranking against a fixed historical sample, not a score, not a grade, and not a percentage of body fat.
Why child BMI percentile uses age in months, not years
The CDC curves are defined at half-month intervals because growth is fast enough that a birthday is too coarse. Between 10.0 and 10.5 years the 85th percentile for boys rises from about 19.4 to 19.7. Round a 10-year-and-11-month-old down to “10” and you can shift the reported percentile by three to five points — enough to move a borderline child across the overweight line in either direction. Any tool that asks only for whole years is giving you an approximation.
The curves themselves come from the CDC 2000 reference, built on US survey data collected between 1963 and 1994 and smoothed with the LMS method, which fits three parameters at each age: a skewness (L), a median (M), and a coefficient of variation (S). That is why the distance from the 85th to the 95th percentile is not the same number of BMI units at every age.
The Four Categories and Their Exact Cutoffs
For children aged 2 through 19, the CDC uses four bands. Note that all four are defined by percentile, never by a BMI value:
| Percentile range | CDC category | Share of children |
|---|---|---|
| Below 5th | Underweight | 5% |
| 5th to below 85th | Healthy weight | 80% |
| 85th to below 95th | Overweight | 10% |
| 95th and above | Obesity | 5% |
| 120% of the 95th and above | Severe obesity (class 2) | — |
The share column is worth sitting with. These bands were drawn so that, in the 1963–1994 reference sample, exactly 5 percent of children fell below the 5th and 5 percent above the 95th. The cutoffs are statistical by construction. They were chosen because they track reasonably well with later cardiometabolic risk, not because 17.4 is safe and 17.6 is dangerous.
In 2022 the CDC added extended BMI-for-age percentiles above the 97th, because the original curves ran out of resolution at the top: a child at a BMI of 34 and one at 44 both computed to “99.9th” and looked identical on a chart. The extended curves separate them, which matters for tracking treatment response.
BMI Values at Each Percentile, Age 4 to 16
This is the table most parents actually want: the BMI number that corresponds to each key percentile line, so you can see where your child's raw BMI falls before you calculate anything. Values are rounded from the CDC 2000 reference at the exact birthday; a child four months older sits on a slightly different curve, so treat these as orientation rather than a verdict.
| Age | Boys — BMI at percentile | Girls — BMI at percentile | ||||||
|---|---|---|---|---|---|---|---|---|
| 5th | 50th | 85th | 95th | 5th | 50th | 85th | 95th | |
| 4 | 14.0 | 15.6 | 16.9 | 17.8 | 13.7 | 15.3 | 16.8 | 18.0 |
| 6 | 13.8 | 15.5 | 17.0 | 18.4 | 13.5 | 15.3 | 17.1 | 18.8 |
| 8 | 14.1 | 16.0 | 18.0 | 19.8 | 13.9 | 16.0 | 18.3 | 20.6 |
| 10 | 14.6 | 16.8 | 19.4 | 21.4 | 14.5 | 17.0 | 19.9 | 22.6 |
| 12 | 15.4 | 17.9 | 21.0 | 23.2 | 15.4 | 18.3 | 21.7 | 24.6 |
| 14 | 16.4 | 19.3 | 22.6 | 25.0 | 16.3 | 19.4 | 23.0 | 26.0 |
| 16 | 17.5 | 20.5 | 24.0 | 26.6 | 17.2 | 20.2 | 24.1 | 27.2 |
Read down the 95th column and the adult threshold problem becomes obvious. At age 8 the obesity line is a BMI of 19.8 — a number the adult BMI calculator would call perfectly normal. At age 16 the same line has climbed to 26.6, above the adult overweight cutoff of 25. Applying grown-up categories to a child gets the answer wrong in both directions depending on their age.
Percentile Points Are Not Evenly Spaced
Here is the trap that generates most of the panic. Because BMI is roughly normally distributed, the curves are crowded together in the middle and spread out at the edges. For a 10-year-old girl, the gap from the 25th to the 75th percentile is about 2.4 BMI units, while the gap from the 95th to the 99th is a similar 2.5 units across only four percentile points.
Practically: a 10-year-old who gains about 2 kg more than her height growth accounts for moves roughly one BMI unit, which can carry her from the 45th percentile to the 65th. That looks like a 20-point deterioration on a report card. It is a couple of kilograms. Conversely, a child already at the 97th who gains 3 kg may barely move a percentile point, which makes the percentile a poor tool for tracking progress at the extremes — the reason the CDC built those extended curves.
Track the trajectory, not the reading
A single percentile is a snapshot with wide error bars. What pediatricians actually watch is whether a child holds their channel. Staying near the 30th from age 4 to age 9 is a healthy pattern. Climbing from the 50th to the 88th over the same span is worth a conversation even though every individual reading stayed inside the normal band until the last one. Plot the series rather than the point — the growth chart calculator shows height, weight, and BMI curves together, which is what makes a crossing visible.
Where BMI-for-Age Gets It Wrong
Early puberty inflates the number without extra fat
BMI cannot distinguish muscle and bone from fat, and puberty adds all three fast. A girl who begins her growth spurt at 9 rather than the average 10.5 will sit high on a BMI-for-age curve for two to three years, then settle back as her peers catch up. The percentile is technically correct and clinically misleading. Tanner staging, not the chart, resolves it.
Tall and short children are systematically misread
BMI divides weight by height squared, but human mass scales closer to height cubed during childhood. The result is a mild bias: unusually tall children read slightly high on BMI and unusually short children slightly low, independent of body fat. Pull up the child height percentile calculator alongside the BMI reading — if height is at the 5th or the 95th, discount the BMI percentile accordingly.
Weight percentile and BMI percentile are different measurements
Parents routinely conflate these. A boy at the 90th percentile for weight and the 95th for height lands near the 60th for BMI: he is a big kid, proportionally built. Checking the weight percentile calculator and the BMI percentile side by side is the fastest way to see whether a high weight reading is explained by height.
One more boundary: below age 2, BMI-for-age is not used at all. Infants are assessed with weight-for-length on the WHO standard, and the switch to CDC BMI curves happens at the second birthday. Expect a visible step in the percentile at that changeover.
What to Do With an 85th or 95th Percentile Result
The 2023 AAP clinical practice guideline is explicit that a BMI at or above the 85th percentile is a trigger for evaluation, not for a diet. Evaluation means blood pressure, a lipid panel from age 10, and HbA1c or fasting glucose when other risk factors are present — because the point of the percentile is to find the small number of children whose labs are already moving.
The behavioral side that has evidence behind it is unglamorous: intensive health behavior and lifestyle treatment of 26 or more contact hours over 3 to 12 months, delivered to the family rather than the child. Isolated advice to eat less does not appear in the guideline, and unsupervised restriction in a growing child risks stalling linear growth — which, incidentally, will lower the BMI percentile while making the child worse off.
For a reading between the 5th and the 85th, the correct action is to write it down and check again at the next well visit. That is 80 percent of children, and the single most useful thing you can do with a normal child BMI percentile is build the series that makes next year's reading interpretable.
References
- Centers for Disease Control and Prevention. CDC Growth Charts — BMI-for-age percentile data and the 2022 extended percentiles.
- World Health Organization. Child Growth Standards — the birth-to-24-month standard used before CDC curves apply.