Use the Boys Growth Chart Calculator
Free boys growth chart calculator using official CDC and WHO percentile data. Plot your son's height and weight by age from birth to 20 and get z-scores.
CDC growth charts — standing height for boys ages 2-20
Enter a height to plot your son on the chart
Boys Growth Milestones (50th Percentile)
| Age | Height | Weight |
|---|---|---|
| 2 yr | 87.1 cm | 12.7 kg |
| 3 yr | 95.1 cm | 14.3 kg |
| 4 yr | 102.4 cm | 16.3 kg |
| 5 yr | 109.2 cm | 18.4 kg |
| 6 yr | 115.5 cm | 20.6 kg |
| 7 yr | 121.7 cm | 22.9 kg |
| 8 yr | 127.8 cm | 25.6 kg |
| 9 yr | 133.1 cm | 28.6 kg |
| 10 yr | 138.4 cm | 31.9 kg |
| 11 yr | 143.7 cm | 35.6 kg |
| 12 yr | 149.3 cm | 39.9 kg |
| 13 yr | 156.2 cm | 45.3 kg |
| 14 yr | 163.2 cm | 50.8 kg |
| 15 yr | 169.0 cm | 56.0 kg |
| 16 yr | 173.4 cm | 60.8 kg |
| 17 yr | 175.2 cm | 64.4 kg |
| 18 yr | 176.1 cm | 66.9 kg |
| 19 yr | 176.5 cm | 68.3 kg |
| 20 yr | 176.8 cm | 69.0 kg |
Source: CDC/WHO growth reference data (approximate educational values). Highlighted row matches selected age.
Educational Estimate
This calculator uses CDC and WHO reference data approximations for educational purposes. Results are not a substitute for clinical growth charts plotted by your pediatrician. Growth patterns vary among individuals and should be evaluated alongside other health indicators. Consult your child's doctor for concerns about growth.
Your rating helps improve Boys Growth Chart Calculator. We store only an anonymized vote (no personal data).
How to Use Boys Growth Chart Calculator
Step 1: Select age range
Choose Infant (0-24 months) for babies using WHO standards, or Child (2-20 years) for older boys using CDC charts.
Step 2: Enter your son's age
Type or use the slider to enter your son's age in months (infant mode) or years (child mode).
Step 3: Enter height or length
Type your son's standing height or recumbent length in cm or inches. Toggle the unit selector if needed.
Step 4: Enter weight
Type your son's weight in kg or lb. You can enter height only, weight only, or both.
Step 5: Read percentile results
View height and weight percentiles, z-scores, and color-coded classification badges showing where your son falls on the growth curve.
Step 6: Explore the growth chart
Switch between Height-for-Age and Weight-for-Age charts to see your son's position on the percentile curves. Export the chart as PNG or copy a summary.
Key Features
- Height-for-age and weight-for-age percentiles for boys 0-20 years
- WHO growth standards for infants (0-24 months) and CDC charts for children (2-20 years)
- Interactive SVG growth curve with exportable PNG chart
- Z-score calculation with color-coded percentile classification
- Metric and imperial unit support (cm/in, kg/lb)
- Complete milestone reference table with 50th percentile values by age
Understanding Results
Formula
Growth percentiles use the z-score method. For height: z = (measurement − M) / SD, where M is the age-specific median and SD is the standard deviation from the CDC or WHO reference tables. For weight, the LMS method accounts for skewness: z = [(weight/M)L − 1] / (L × S).
The z-score converts to a percentile via the standard normal distribution. A z-score of 0 equals the 50th percentile. A z-score of +1.0 equals approximately the 84th percentile. A z-score of −2.0 equals approximately the 2nd percentile.
Reference Ranges & Interpretation
Percentile classifications used in this calculator:
- Below 3rd percentile: Below typical — evaluate for growth disorder if not tracking consistently
- 3rd–10th percentile: Below average — may be normal, especially with family history of shorter stature
- 10th–25th percentile: Low-normal — within the expected range
- 25th–75th percentile: Normal range — the middle 50% of boys
- 75th–90th percentile: High-normal — within the expected range
- 90th–97th percentile: Above average — may reflect genetic tall stature or advanced maturation
- Above 97th percentile: Above typical — consider evaluation if unexpected
Assumptions & Limitations
This calculator uses smoothed CDC/WHO reference approximations for educational purposes. Results may differ slightly from clinical charts that use precise LMS tables with monthly or semi-annual data points. The reference population is primarily from the United States (CDC) or six international countries (WHO) and may not perfectly represent all ethnic backgrounds. Always compare results with your pediatrician's office growth chart for clinical decisions. Growth assessment should consider family height, pubertal stage, and overall health status — not percentile alone.
Complete Guide: Boys Growth Chart Calculator
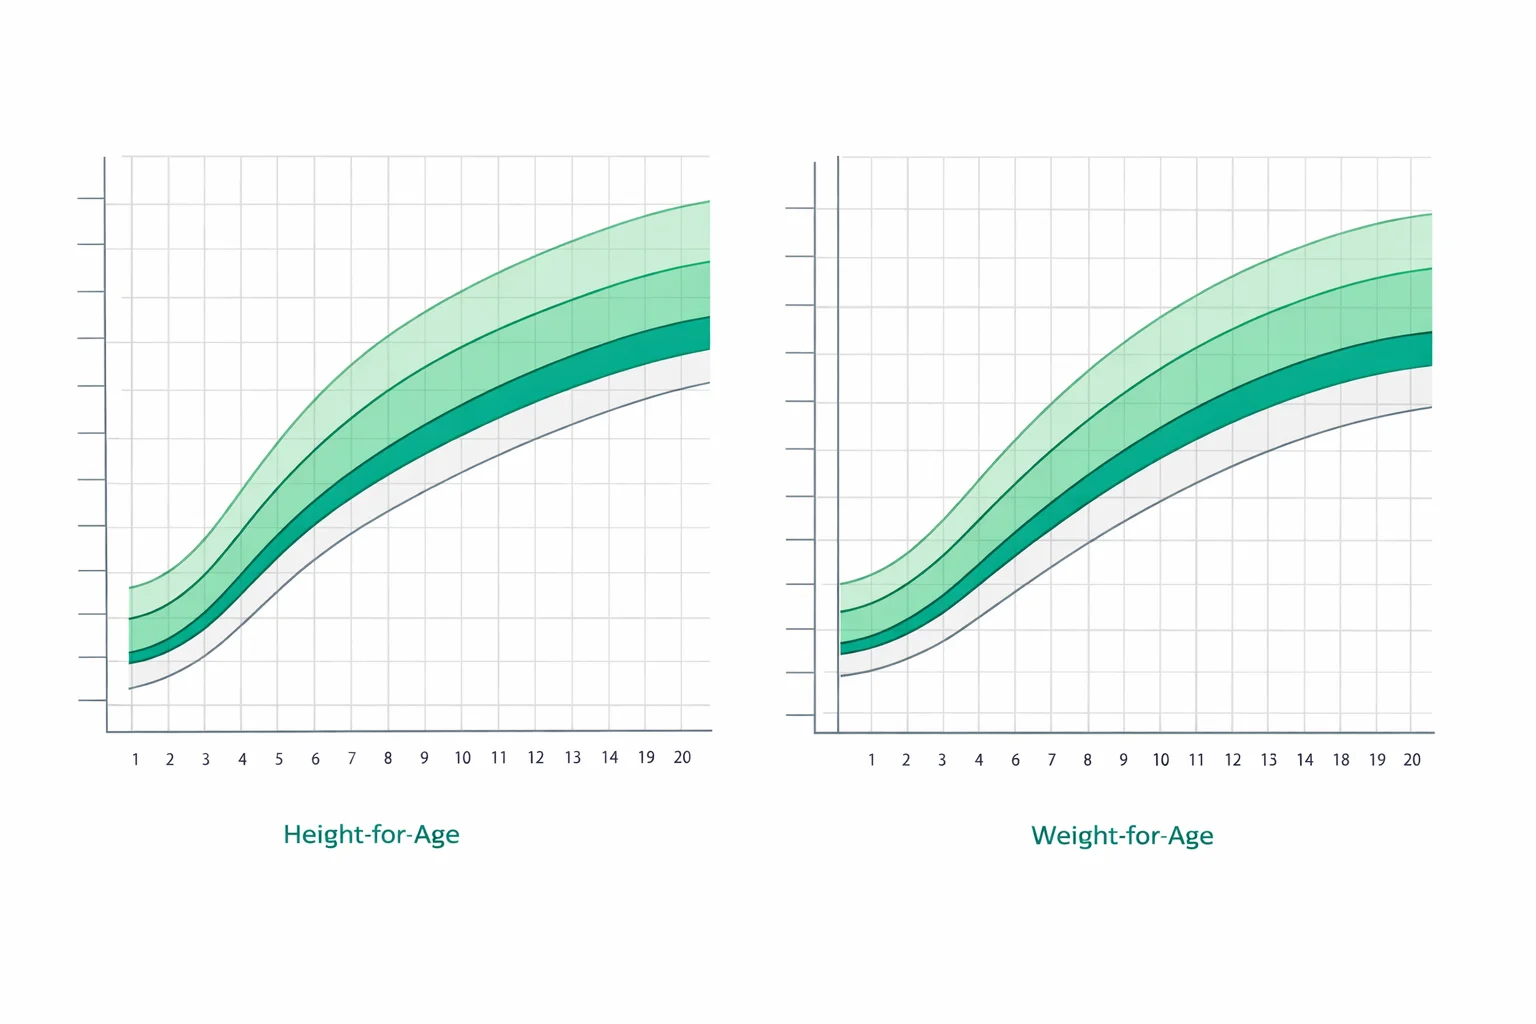
Table of Contents
What Is a Boys Growth Chart Calculator?
A boys growth chart calculator plots your son's height and weight against CDC or WHO reference data so you can see exactly where he falls compared to other boys his age. If your 10-year-old son measures 138 cm (54.3 in) tall, for example, this tool instantly tells you he sits at the 50th percentile — meaning he is taller than half of boys that age and shorter than the other half.
Pediatricians have used growth charts since the 1970s, but parents now have access to the same percentile curves at home. Whether you need a boys height percentile calculator or want to check boys weight percentile rankings, this tool covers both. The key insight is that growth charts track patterns, not single snapshots. A boy consistently tracking the 25th percentile is growing normally; a boy who drops from the 75th to the 10th percentile over six months may need medical evaluation, even though the 10th percentile is still within the “normal” range.
How Growth Percentiles Are Calculated
Growth percentiles use a statistical method called the LMS (Lambda-Mu-Sigma) approach. For each age and sex, three parameters are defined: L (skewness), M (median), and S (coefficient of variation). Your child's z-score is then:
When L is close to 1 (as with height), this simplifies to z = (measurement − M) / SD. The z-score converts to a percentile via the standard normal distribution: a z-score of 0 equals the 50th percentile, +1.645 equals the 95th, and −1.645 equals the 5th.
Worked example: A 10-year-old boy measures 143.7 cm. The CDC median (M) for this age is 138.4 cm with an SD of 5.3 cm. His z-score is (143.7 − 138.4) / 5.3 = +1.0, placing him at approximately the 84th percentile. That means he's taller than 84% of 10-year-old boys in the reference population.
CDC vs. WHO Growth Charts for Boys
Two major reference sets exist, and they serve different age ranges. Understanding which one applies to your son matters because the same measurement can yield different percentiles on each chart.
| Feature | WHO (0–24 months) | CDC (2–20 years) |
|---|---|---|
| Population | International (6 countries) | U.S. national survey data |
| Standard type | Prescriptive (how children should grow) | Descriptive (how children did grow) |
| Feeding | Breastfed infants | Mixed feeding |
| Measurement | Recumbent length | Standing height |
| Recommended by | AAP for ages 0–24 mo | AAP for ages 2–20 y |
The American Academy of Pediatrics recommends WHO charts for children under 2 and CDC charts for ages 2–20. Our calculator automatically switches between these references based on the age range you select. For a comprehensive look at both boys and girls, try our Growth Chart Calculator.
Average Boy Growth Chart by Age: Height Milestones
Boys grow fastest during infancy and puberty. A newborn boy averages 49.9 cm (19.6 in) and roughly doubles in length by age 4, reaching about 102 cm (40.2 in). Growth then slows to a steady 5–7 cm per year until the pubertal growth spurt kicks in around age 11–13.
| Age | 50th Pct (cm) | 50th Pct (in) | Annual Gain |
|---|---|---|---|
| Birth | 49.9 | 19.6 | — |
| 1 year | 75.7 | 29.8 | ~25.8 cm |
| 2 years | 87.1 | 34.3 | ~11.4 cm |
| 5 years | 109.2 | 43.0 | ~7.0 cm |
| 10 years | 138.4 | 54.5 | ~5.6 cm |
| 13 years | 163.2 | 64.3 | ~8.3 cm |
| 18 years | 176.5 | 69.5 | ~0.4 cm |
By age 18, the median boy reaches 176.5 cm (5 ft 9.5 in). Most boys stop growing between ages 16 and 18, though some continue adding 1–2 cm through age 20. To see where your son falls compared to peers at any age, our Height Percentile Calculator provides detailed percentile rankings using the same CDC/WHO reference data.
Average Weight-for-Age in Boys
Weight gain in boys follows a different curve than height. Newborn boys average 3.3 kg (7.3 lb) and typically double their birth weight by 5 months and triple it by 12 months. After infancy, weight gain accelerates again during puberty, with boys adding an average of 5–7 kg per year between ages 11 and 15.
| Age | 50th Pct (kg) | 50th Pct (lb) | Annual Gain |
|---|---|---|---|
| Birth | 3.3 | 7.3 | — |
| 6 months | 7.9 | 17.4 | — |
| 1 year | 9.6 | 21.2 | — |
| 2 years | 12.7 | 28.0 | ~3.1 kg |
| 5 years | 18.4 | 40.6 | ~2.0 kg |
| 10 years | 31.9 | 70.3 | ~2.7 kg |
| 15 years | 60.8 | 134.0 | ~5.8 kg |
| 20 years | 69.0 | 152.1 | ~1.6 kg |
Weight-for-age percentiles are less meaningful after about age 10 because boys at the same age can vary dramatically in pubertal timing. A 12-year-old at the 90th percentile for weight may simply be an early maturer. For older boys, BMI-for-age percentiles from our Child BMI Percentile Calculator are often more clinically useful than weight-for-age alone.
The Puberty Growth Spurt in Boys
Boys experience peak height velocity (PHV) around age 13–14, growing an average of 8–10 cm (3–4 inches) per year at the peak. This is roughly 2 years later than girls, which is why boys often end up taller. The typical sequence:
- Tanner Stage 2 (ages 9–14): Testicular enlargement begins. Growth accelerates to 6–7 cm/year.
- Tanner Stage 3 (ages 11–15): Peak height velocity. Boys may grow 8–10 cm/year. Weight gain accelerates.
- Tanner Stage 4–5 (ages 12–17): Growth decelerates. Voice deepens, muscle mass increases. Growth plates begin closing.
- Post-puberty: Final 1–3 cm of height may be added over 1–2 years after PHV. Most boys reach adult height by 16–18.
Early or late puberty is common and does not necessarily indicate a problem. A boy who starts puberty at 14 instead of 12 may temporarily appear short compared to peers but usually catches up by age 17–18. If puberty hasn't begun by age 14, a pediatric evaluation is recommended.
Common Mistakes When Reading Growth Charts
Parents and even some healthcare providers misinterpret growth charts. Avoiding these four pitfalls leads to better-informed decisions:
- Treating a single percentile as a diagnosis. The 10th percentile is not “bad” and the 90th is not “good.” By definition, 10% of healthy boys fall below the 10th percentile. What matters is the trend over time.
- Comparing boys to girls. Boys and girls have different growth trajectories. A boy at the 50th percentile on a girls' chart would appear to be at a different percentile. Always use sex-specific charts.
- Mixing up length and height. Recumbent length (lying down, for infants) is about 0.7 cm longer than standing height. Switching from length to height at age 2 can create a false “dip” on the chart if not accounted for.
- Ignoring measurement technique. A 1 cm measurement error at age 5 shifts the percentile by roughly 5–8 points. Measure without shoes, heels against the wall, and at the same time of day (children are 0.5–1 cm taller in the morning).
When to Talk to Your Pediatrician
Most growth variations are normal, but certain patterns warrant a medical evaluation:
- Crossing two or more major percentile lines (e.g., dropping from the 75th to the 25th) over 6–12 months
- Height below the 3rd percentile or above the 97th with no family history of short or tall stature
- Growth velocity below 4 cm/year between ages 4 and the start of puberty
- Height and weight percentiles dramatically different (e.g., height at the 80th but weight at the 10th), which may suggest a nutritional or endocrine issue
- No signs of puberty by age 14 in boys
Your pediatrician can order bone-age X-rays, screen for growth hormone deficiency, or check thyroid function if growth patterns are concerning. For tracking your son's height percentile over time with more detail, our Child Height Percentile Calculator offers history tracking and growth velocity estimates.
References
- CDC Growth Charts for the United States. National Center for Health Statistics. cdc.gov/growthcharts
- WHO Child Growth Standards: Length/height-for-age, weight-for-age, weight-for-length, weight-for-height and body mass index-for-age. World Health Organization, 2006. who.int/tools/child-growth-standards
- Kuczmarski RJ, et al. 2000 CDC Growth Charts for the United States: Methods and Development. Vital and Health Statistics, Series 11, No. 246. 2002.
- Tanner JM. Growth at Adolescence. 2nd ed. Oxford: Blackwell Scientific Publications; 1962.

Written by Jurica Šinko
Founder & CEO
Entrepreneur and health information advocate, passionate about making health calculations accessible to everyone through intuitive digital tools.
View full profileFrequently Asked Questions
What is a normal height for a 10-year-old boy?
The CDC 50th percentile height for a 10-year-old boy is 138.4 cm (54.5 inches). The normal range spans from about 128 cm (5th percentile) to 149 cm (95th percentile). Any height within the 5th to 95th percentile range is considered normal as long as the child is tracking consistently along their growth curve.
How do I know if my son is growing normally?
Consistent tracking along the same percentile curve over time is the best indicator of normal growth. A boy who tracks at the 25th percentile throughout childhood is growing normally. Warning signs include crossing two or more major percentile lines within 6-12 months, or growth velocity below 4 cm per year between ages 4 and puberty.
What is the difference between WHO and CDC growth charts for boys?
WHO charts cover ages 0-24 months and describe how breastfed children should grow based on international data from six countries. CDC charts cover ages 2-20 years and describe how U.S. children actually grew based on national survey data. The American Academy of Pediatrics recommends WHO charts for infants and CDC charts for children over 2.
When do boys stop growing in height?
Most boys reach their adult height between ages 16 and 18, though some continue growing 1-2 cm through age 20. The pubertal growth spurt typically peaks around age 13-14 with 8-10 cm of growth per year. Boys who start puberty later may continue growing later as well.
What does the 50th percentile mean on a boys growth chart?
The 50th percentile is the median, meaning exactly half of boys that age are taller (or heavier) and half are shorter (or lighter). It does not mean average or ideal. A healthy boy can track anywhere from the 5th to the 95th percentile. The percentile line a child follows matters more than the specific number.
Should I worry if my son is below the 5th percentile for height?
Not necessarily. About 5% of healthy boys naturally fall below the 5th percentile, often due to familial short stature or constitutional growth delay. Concern is warranted if the child has crossed downward across percentile lines, if growth velocity is below 4 cm per year, or if there is no family history of short stature. A pediatric evaluation with bone-age X-ray can clarify.
How much weight should a boy gain each year?
Weight gain varies by age. Boys typically gain about 2-3 kg per year from ages 2-10, then 5-7 kg per year during puberty (ages 11-15). After puberty, weight gain slows to 1-2 kg per year. A newborn boy usually doubles birth weight by 5 months and triples it by 12 months.
Related Calculators
Baby Food Calculator — Solids Introduction & Portions
Estimate age‑appropriate portions and plan meal frequency with the baby food calculator. Log new foods, track allergens, and export a simple weekly menu.
Infant Growth Chart Calculator
Track weight, length, and head size with the infant growth chart calculator using WHO percentiles. See trends on clear charts and compare age-based progress.
Baby Length Percentile Calculator — WHO Reference Guide
Check WHO length‑for‑age percentiles with the baby length percentile calculator. Input age, sex, and length to see your percentile and track growth trends.
Baby Milestone Calculator — Track Skills by Age & Stage
Use our baby milestone calculator to see what’s typical by corrected age. Explore early, typical, and later windows for motor, language, and cognitive skills.
Baby Weight Percentile Calculator — WHO Growth Guide
Use the baby weight percentile calculator to see WHO weight‑for‑age percentiles. Enter age, sex, and weight to get your percentile, z‑score, and tips.
Breast Milk Storage Calculator — Safety & Expiry Guide
Calculate safe storage times for fresh or thawed milk with our breast milk storage calculator. See fridge/freezer expiry dates, cooler limits, and labels.